Muted profit growth, Falling retail ownership, Improving FDI and more...
This Week In Data #125
In this edition of This Week In Data we discuss:
Double digit profit growth during the March quarter
Operating profit growth however remains muted at single digits
Domestic institutions now own more of the market than foreign institutions
Share of Individuals in market ownership falls sharply during the March quarter
Credit card payments are seeing an uptick
FDI grows by double digits in FY25 but repatriation and outward FDI drag net FDI
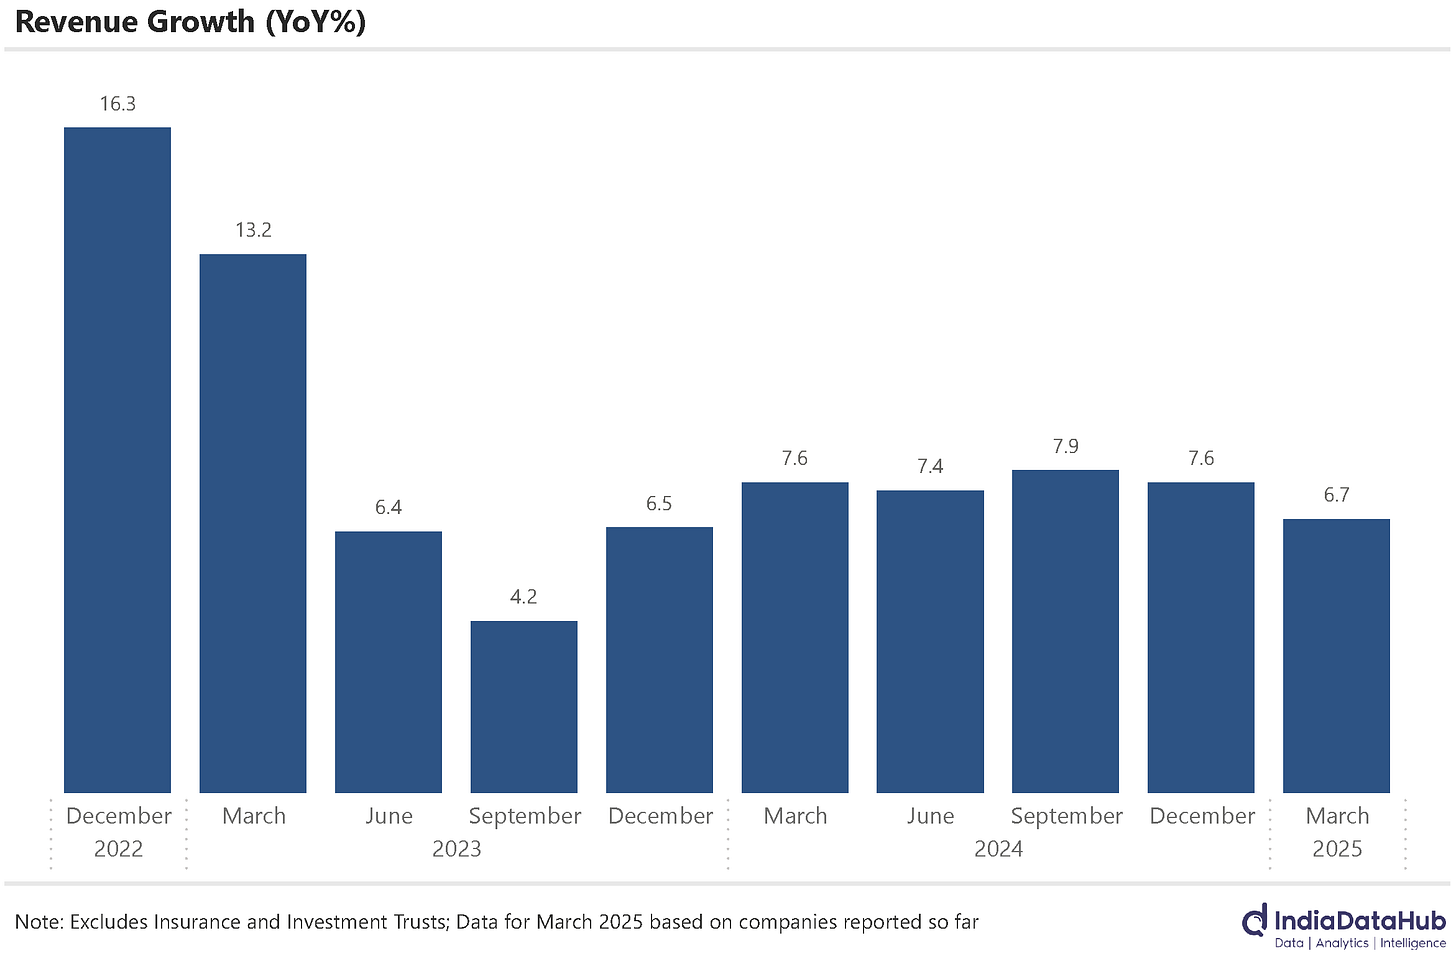
We are coming towards the end of the 4Q results season and the results so far have been muted. In terms of revenue growth, 4QFY25 will likely be the 8th consecutive quarter of single-digit growth. Of the companies that have reported so far, revenue growth has totalled 7% YoY, down from ~8% in the preceding two quarters.
Operating profit growth has also been in the single digits for the 5th consecutive quarter. However net profit growth is running in double digits currently driven by further moderation in interest expense. Aggregate net profit has grown by 13% YoY so far broadly the same growth as during the December quarter. This is being aided by continued deleveraging. Overall interest expense is running at just 2.3% of revenue so far for the March quarter, the lowest in the last few years.
Domestic institutions now own a higher share of Indian stocks than foreign institutions. As of the March quarter, the domestic institutions (mutual funds, insurance companies, Banks, etc) owned 17.1% of the stocks. This is slightly higher than the 16.9% ownership by foreign institutions (largely FPIs). The share of retail investors (individuals) has fallen sharply to 9.5% during the March quarter, the lowest in the last 7 quarters.
Domestic consumption seems to be recovering. Overall credit card spending has grown by ~20% YoY in the last two months (Mar-Apr). This is the strongest growth over the past year and is significantly faster than the low double-digit growth seen at the start of the year.
In absolute terms, total credit card spending has become large now. In absolute terms, the total spending through credit cards has almost tripled in the last 5 years. In FY25, the total spending through credit cards was over 6% of GDP or ₹21 trillion (US$250bn) in absolute terms. And almost 100% of the credit card payments are final household consumption. Household consumption accounts for ~60% of the GDP and thus credit card spending captures ~10% of India’s consumption now.
The other notable trend is that the ticket size of a credit card payment has been falling in recent months. In April the average transaction size of credit card payments was just under ₹4100, down 10% on a YoY basis and the lowest in almost 4 years. So as the credit card base has increased sharply in recent months, the incremental spends seem to be for substantially smaller ticket transactions.
Of course, UPI dwarfs Credit cards. In FY25 total spending using UPI was ₹260 trillion or 10x as much. However, the growth of UPI does not seem to have come at the expense of Credit cards. The average transaction size of a UPI payment was just ₹1400 in FY25, less than a third of that of a Credit card. So the two modes of payments do not appear to be directly competing against each other.
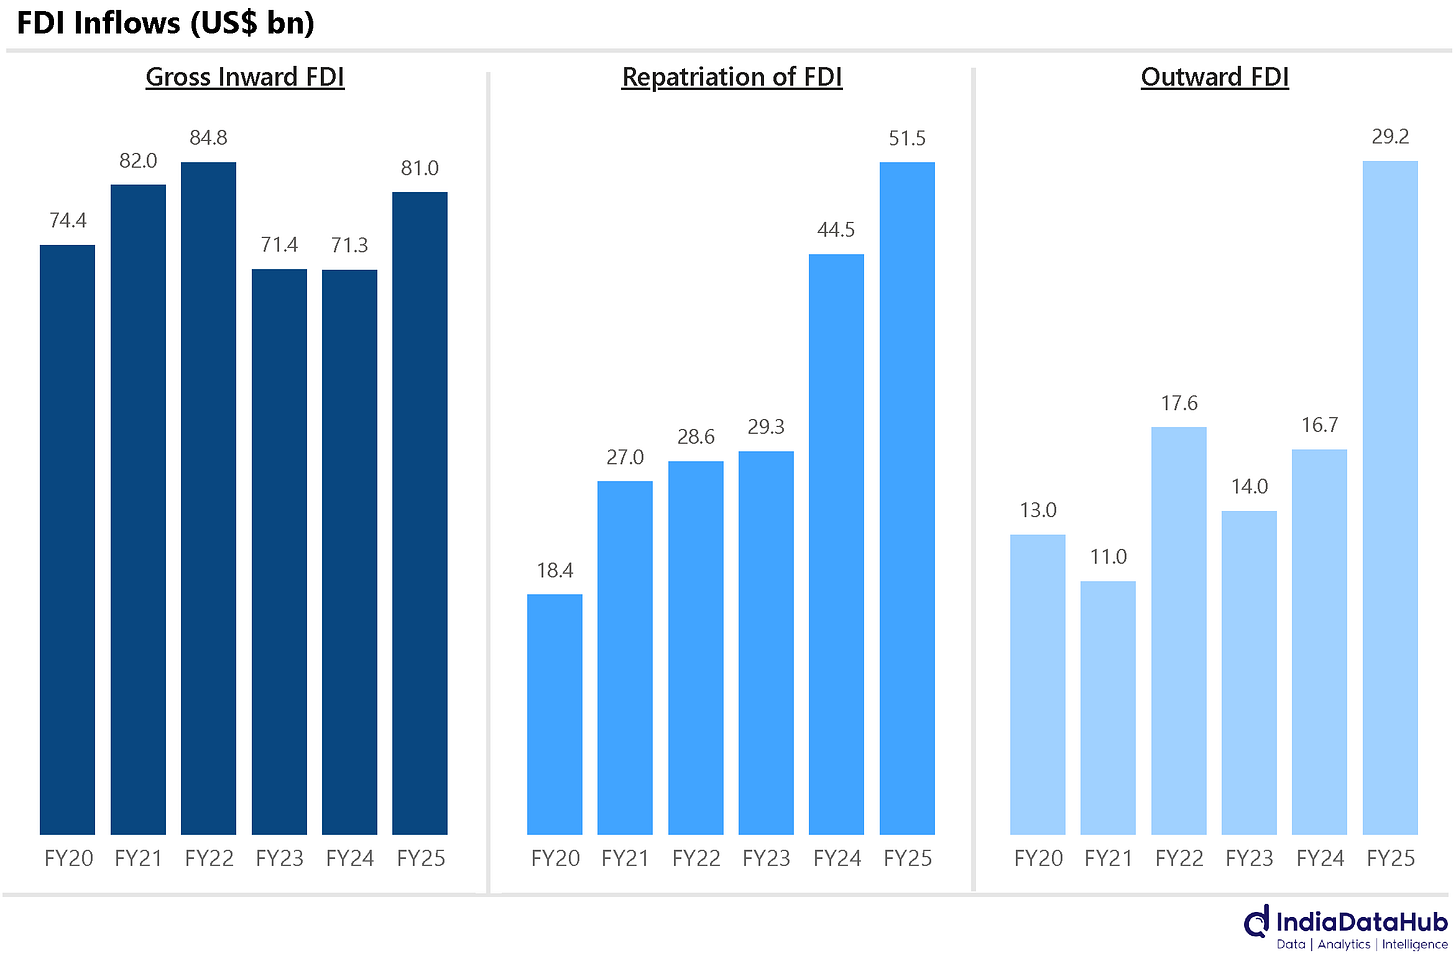
Lastly, FDI. While the headline data looks bad – net FDI received by India in FY25 was close to 0 – the details are encouraging. Gross FDI received by India in FY25 totalled US$81bn, up 14% YoY and only modestly lower than the all-time high of US$85bn in FY22. What caused the net FDI to decline sharply though was the sharp increase in repatriation of existing FDI and outward FDI by Indian companies. Repatriation of existing FDI totalled US$51.5bn in FY25, up 16% YoY and the highest ever. And outward FDI by Indian companies rose 75% YoY to US$29bn.
That’s it for this week. It is the Monaco Grand Prix this weekend. Do not miss it…


