
In this edition of This Week In Data, we discuss:
Kharif Acreage has seen a strong growth so far with Rice leading the way
Water levels in key reservoirs is healthy boding well for Rabi crop
After declining sharply in the last few quarters credit growth is remaining stable
Exports to USA are falling across the board with India a key exception
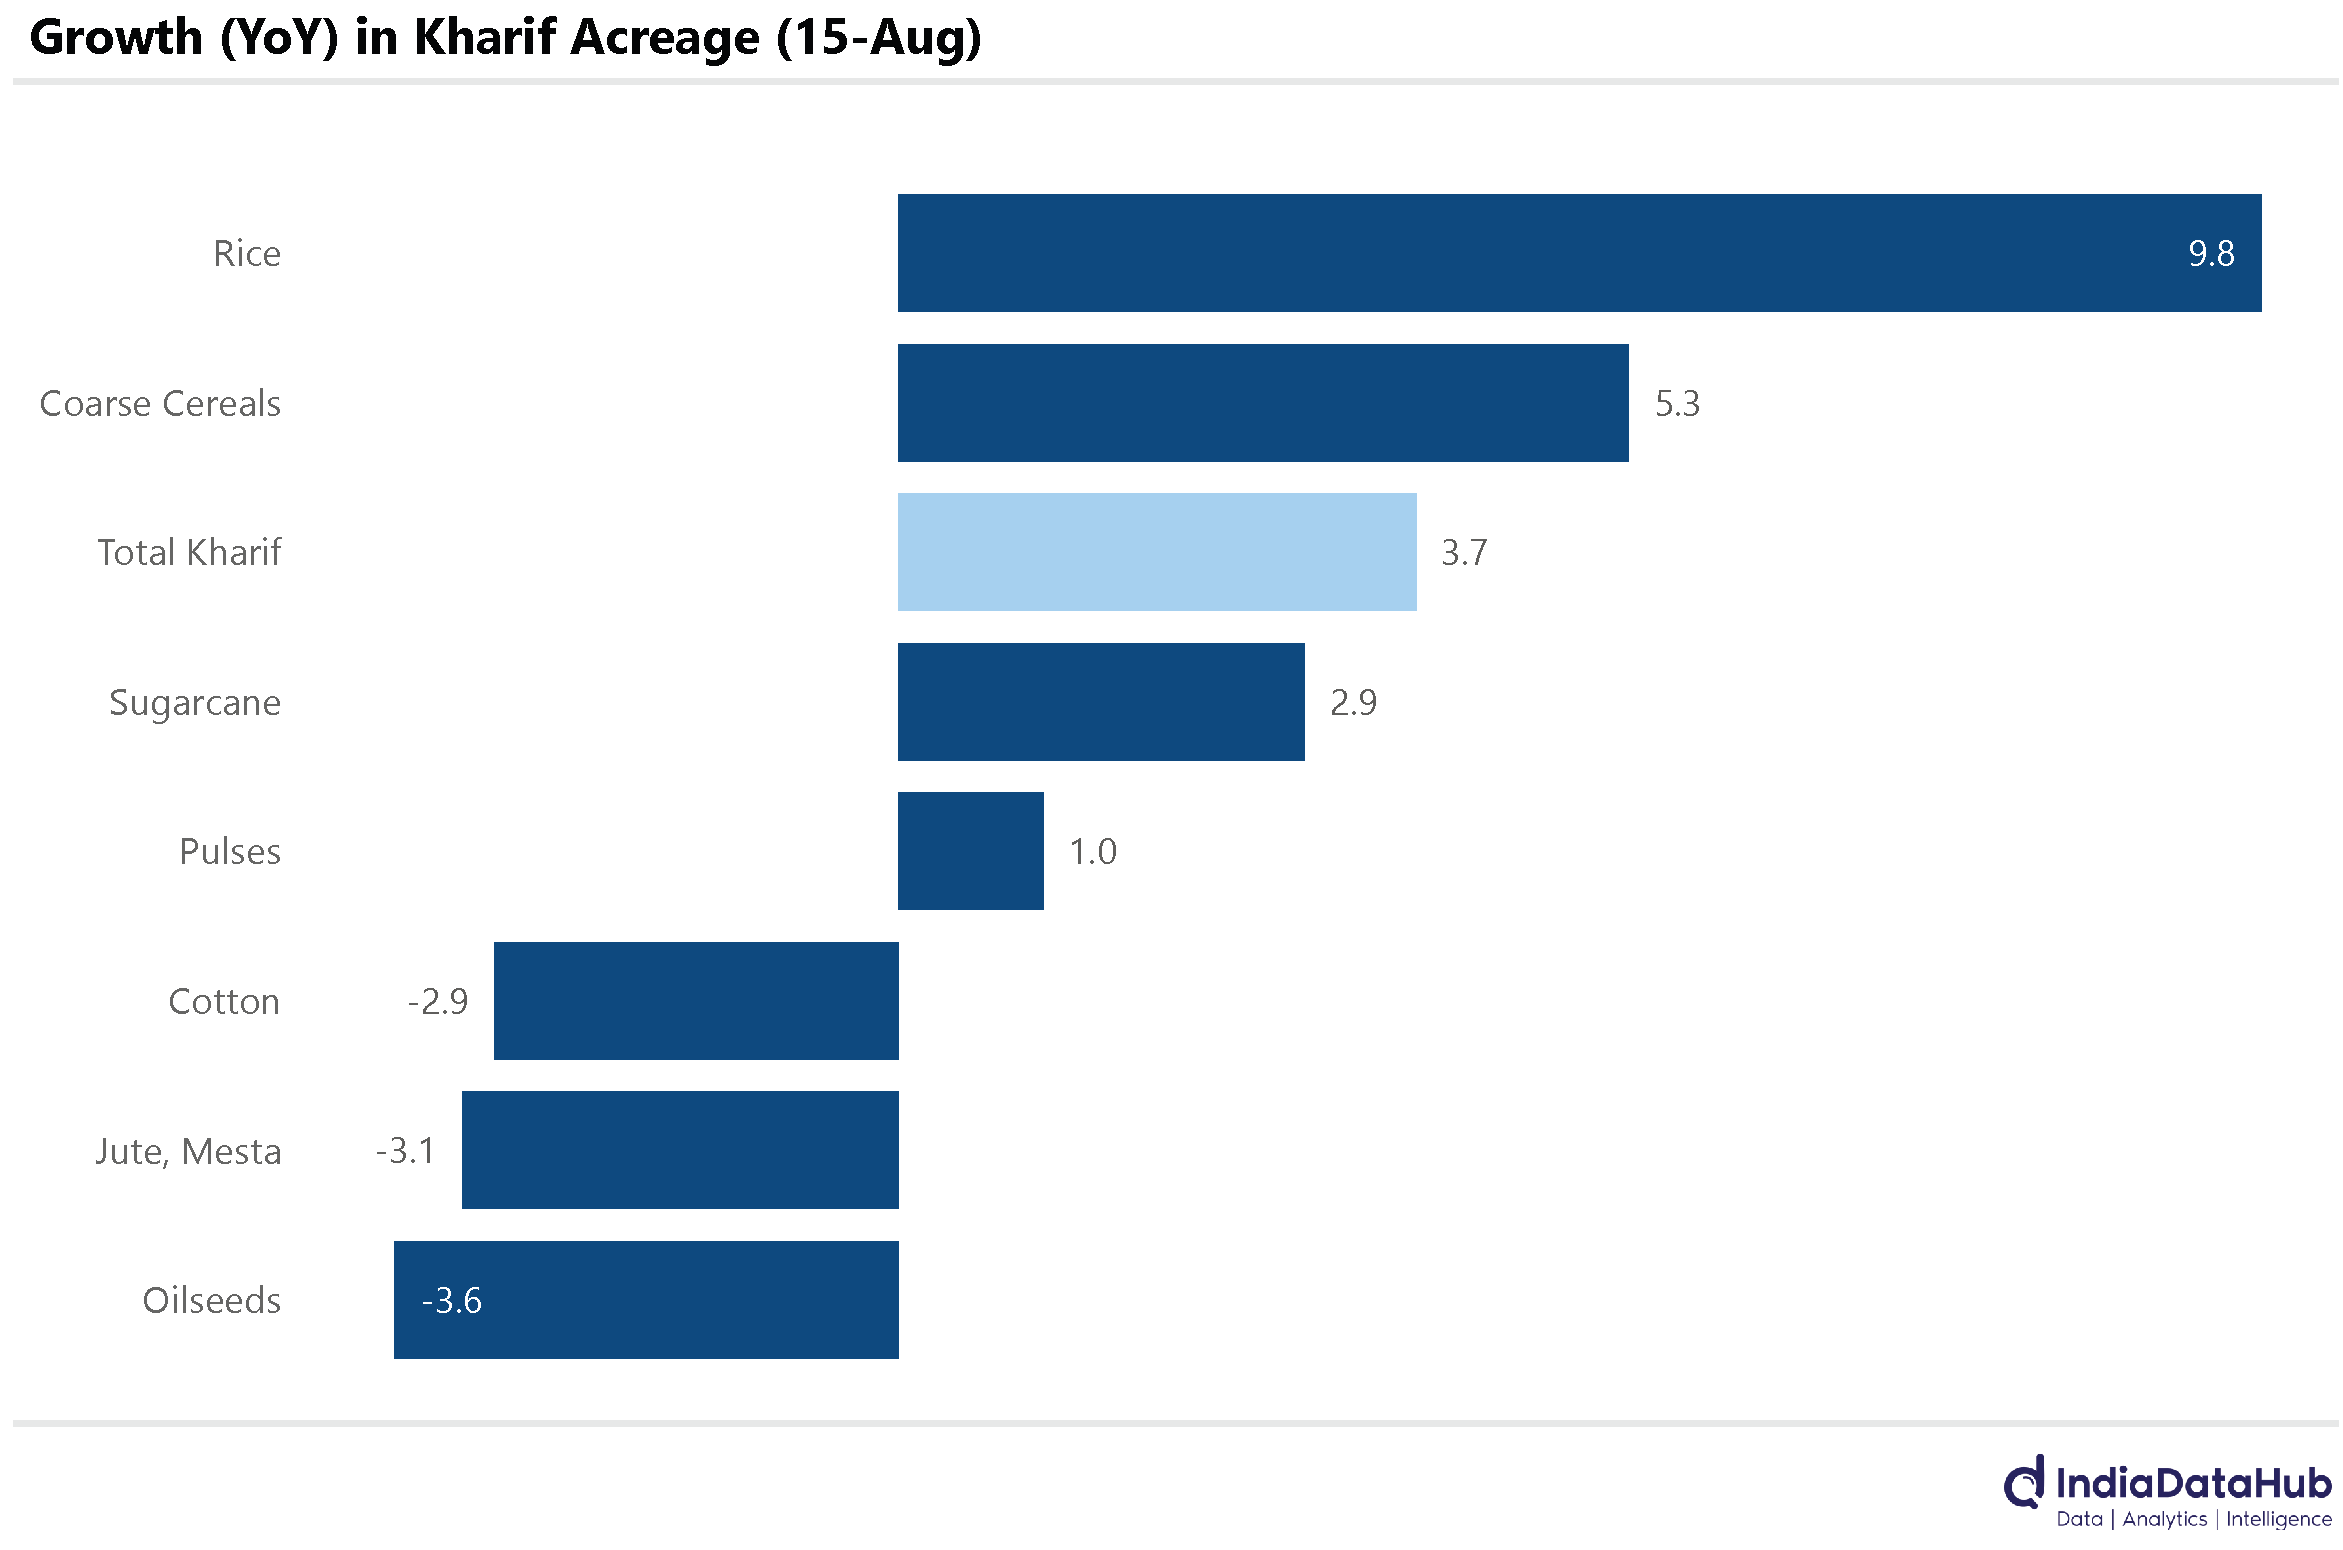
Kharif sowing continues to track higher than last year, and this bodes well for food inflation. As of 15th August, the total acreage under Kharif crops was 104 million hectares, which is almost 4% higher than last year. Rice continues to be the key driver of higher acreage, with acreage under rice being almost 10% higher on a YoY basis. Coarse cereals acreage is also 5% higher than last year. However, Pulses acreage is broadly unchanged, and that for Oilseeds and Cotton is lower than last year.
Rainfall has been good so far, and water levels in the major reservoirs are almost 25% above normal. Regionally, the spread has not been skewed with reservoir levels at least 10% above normal in each region. Reservoir levels in East India are the lowest, but still 12% above the normal.
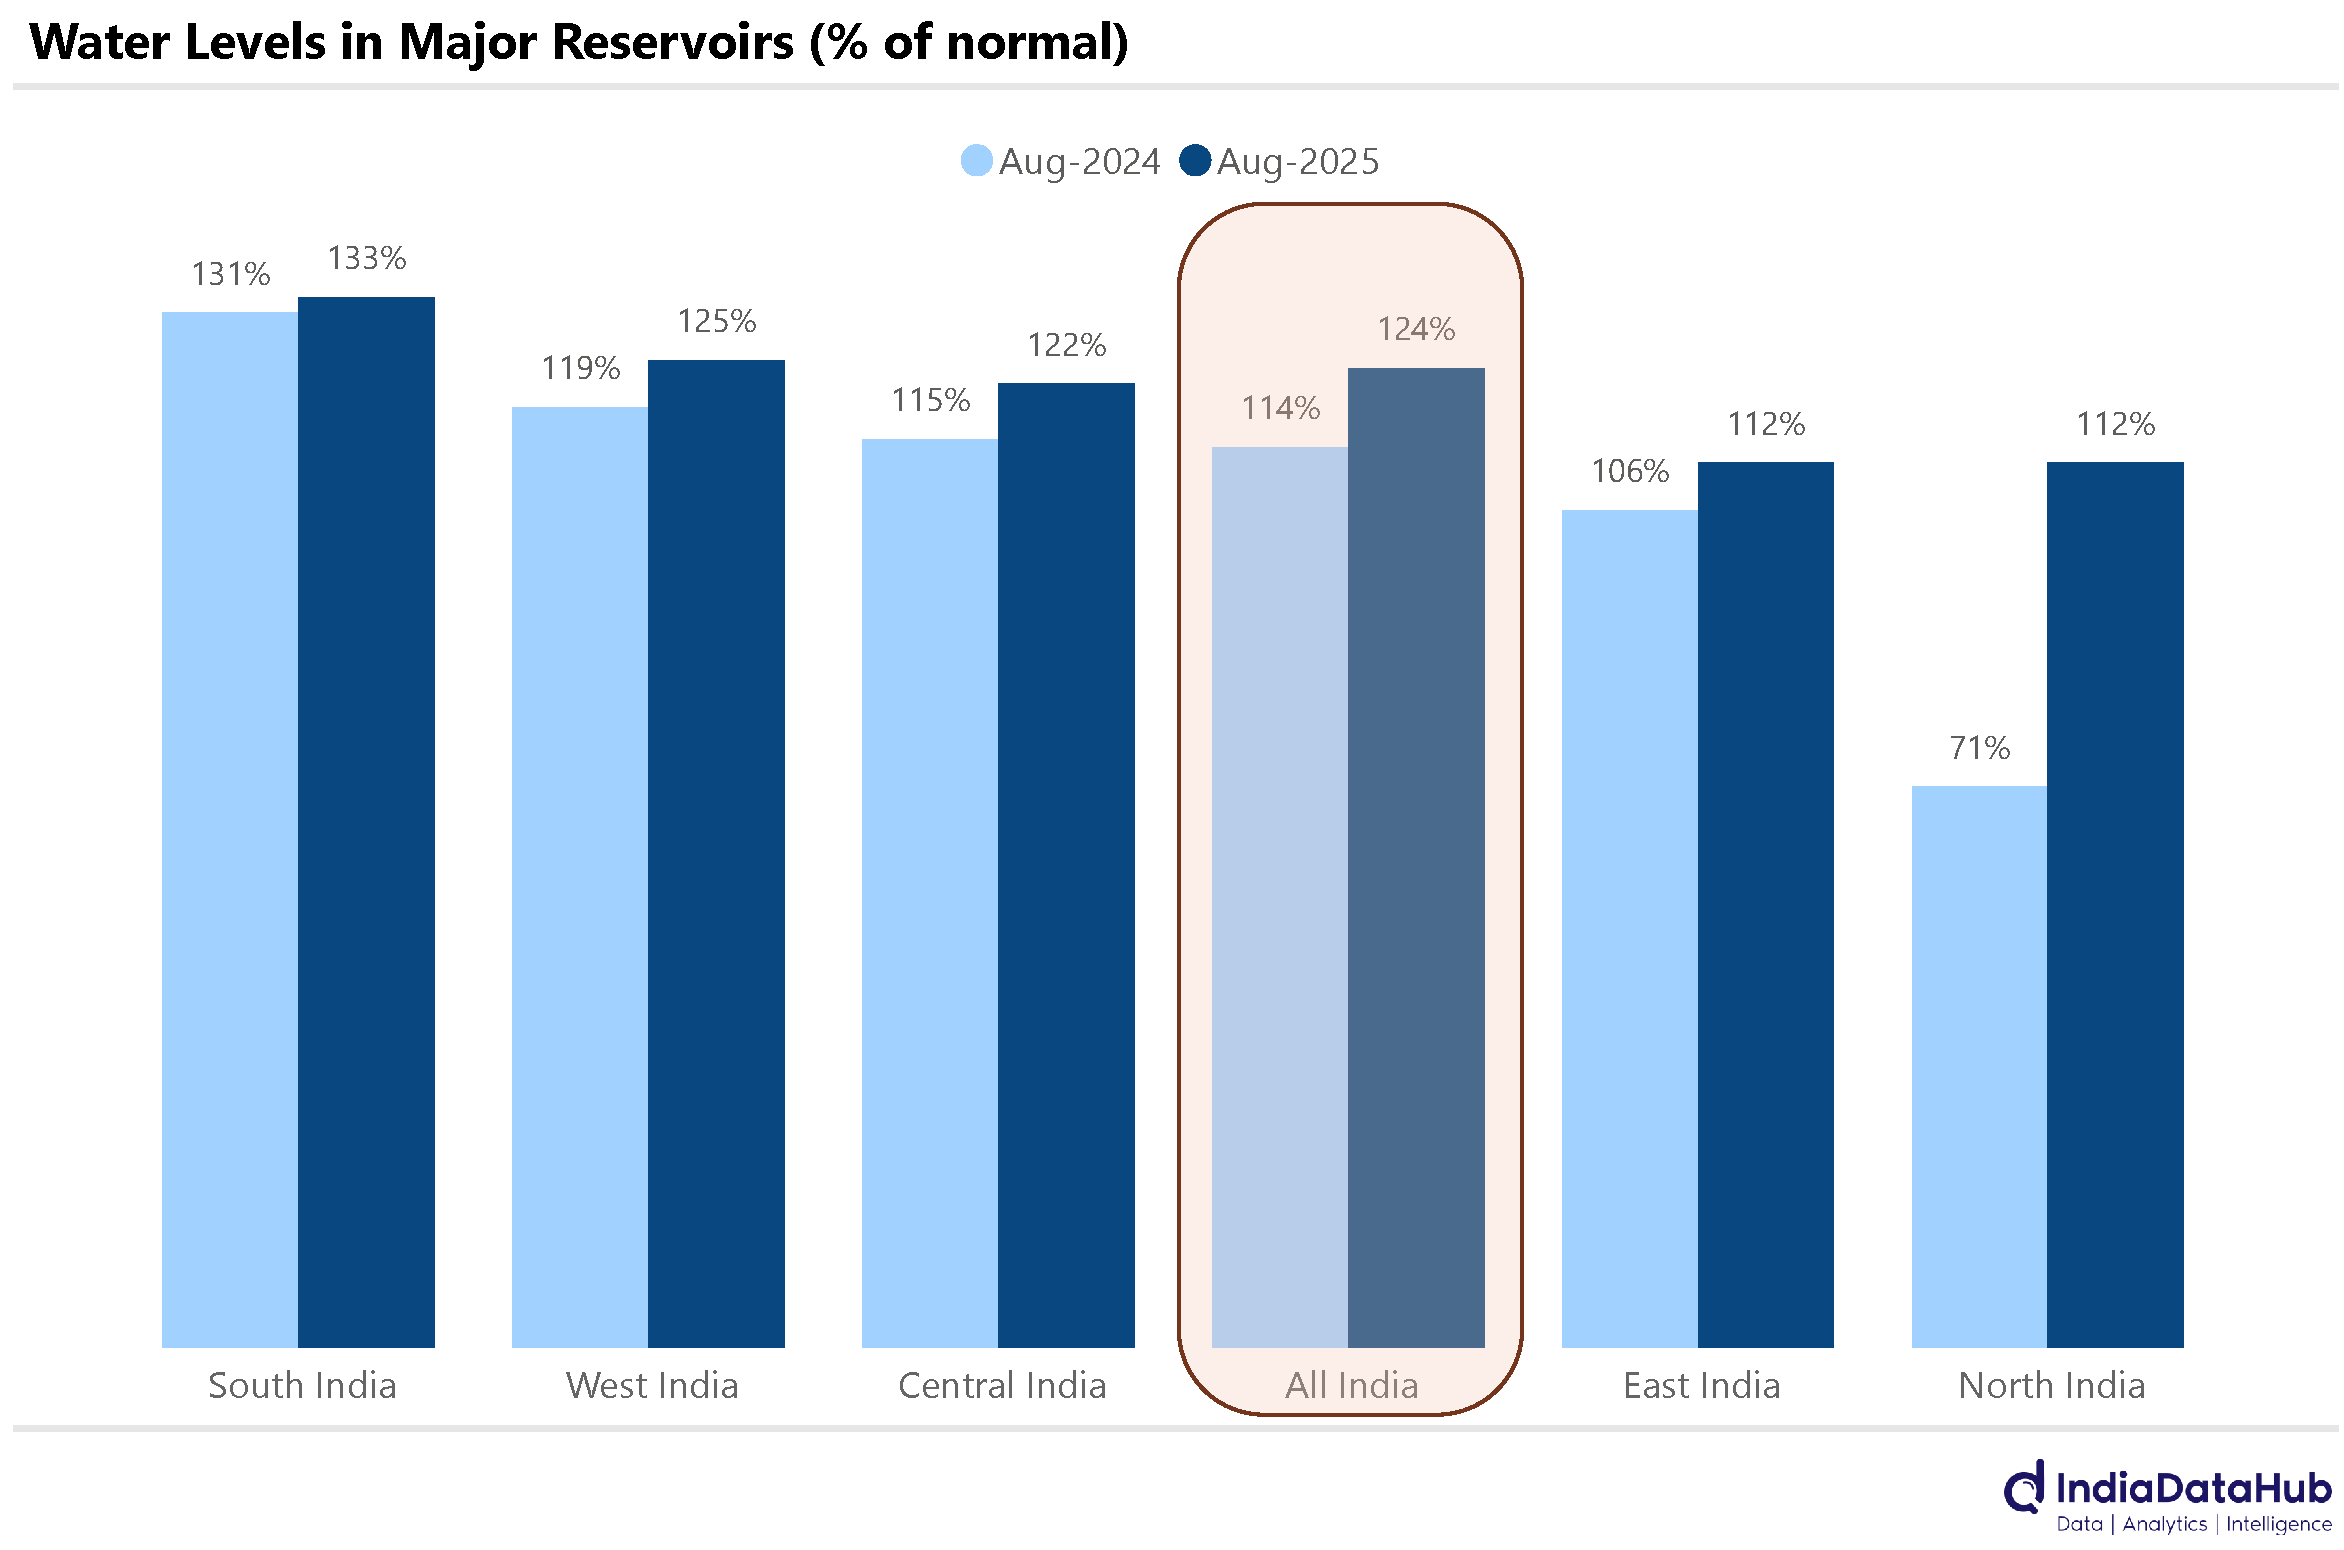
A year ago, overall reservoir levels were 13% above normal but in North India they were 30% below normal. The focus now shifts to how the monsoon season ends. If we get good rains in September, it will mean good soil moisture heading into the Rabi season, which will bode well for the winter crop. Fingers crossed…
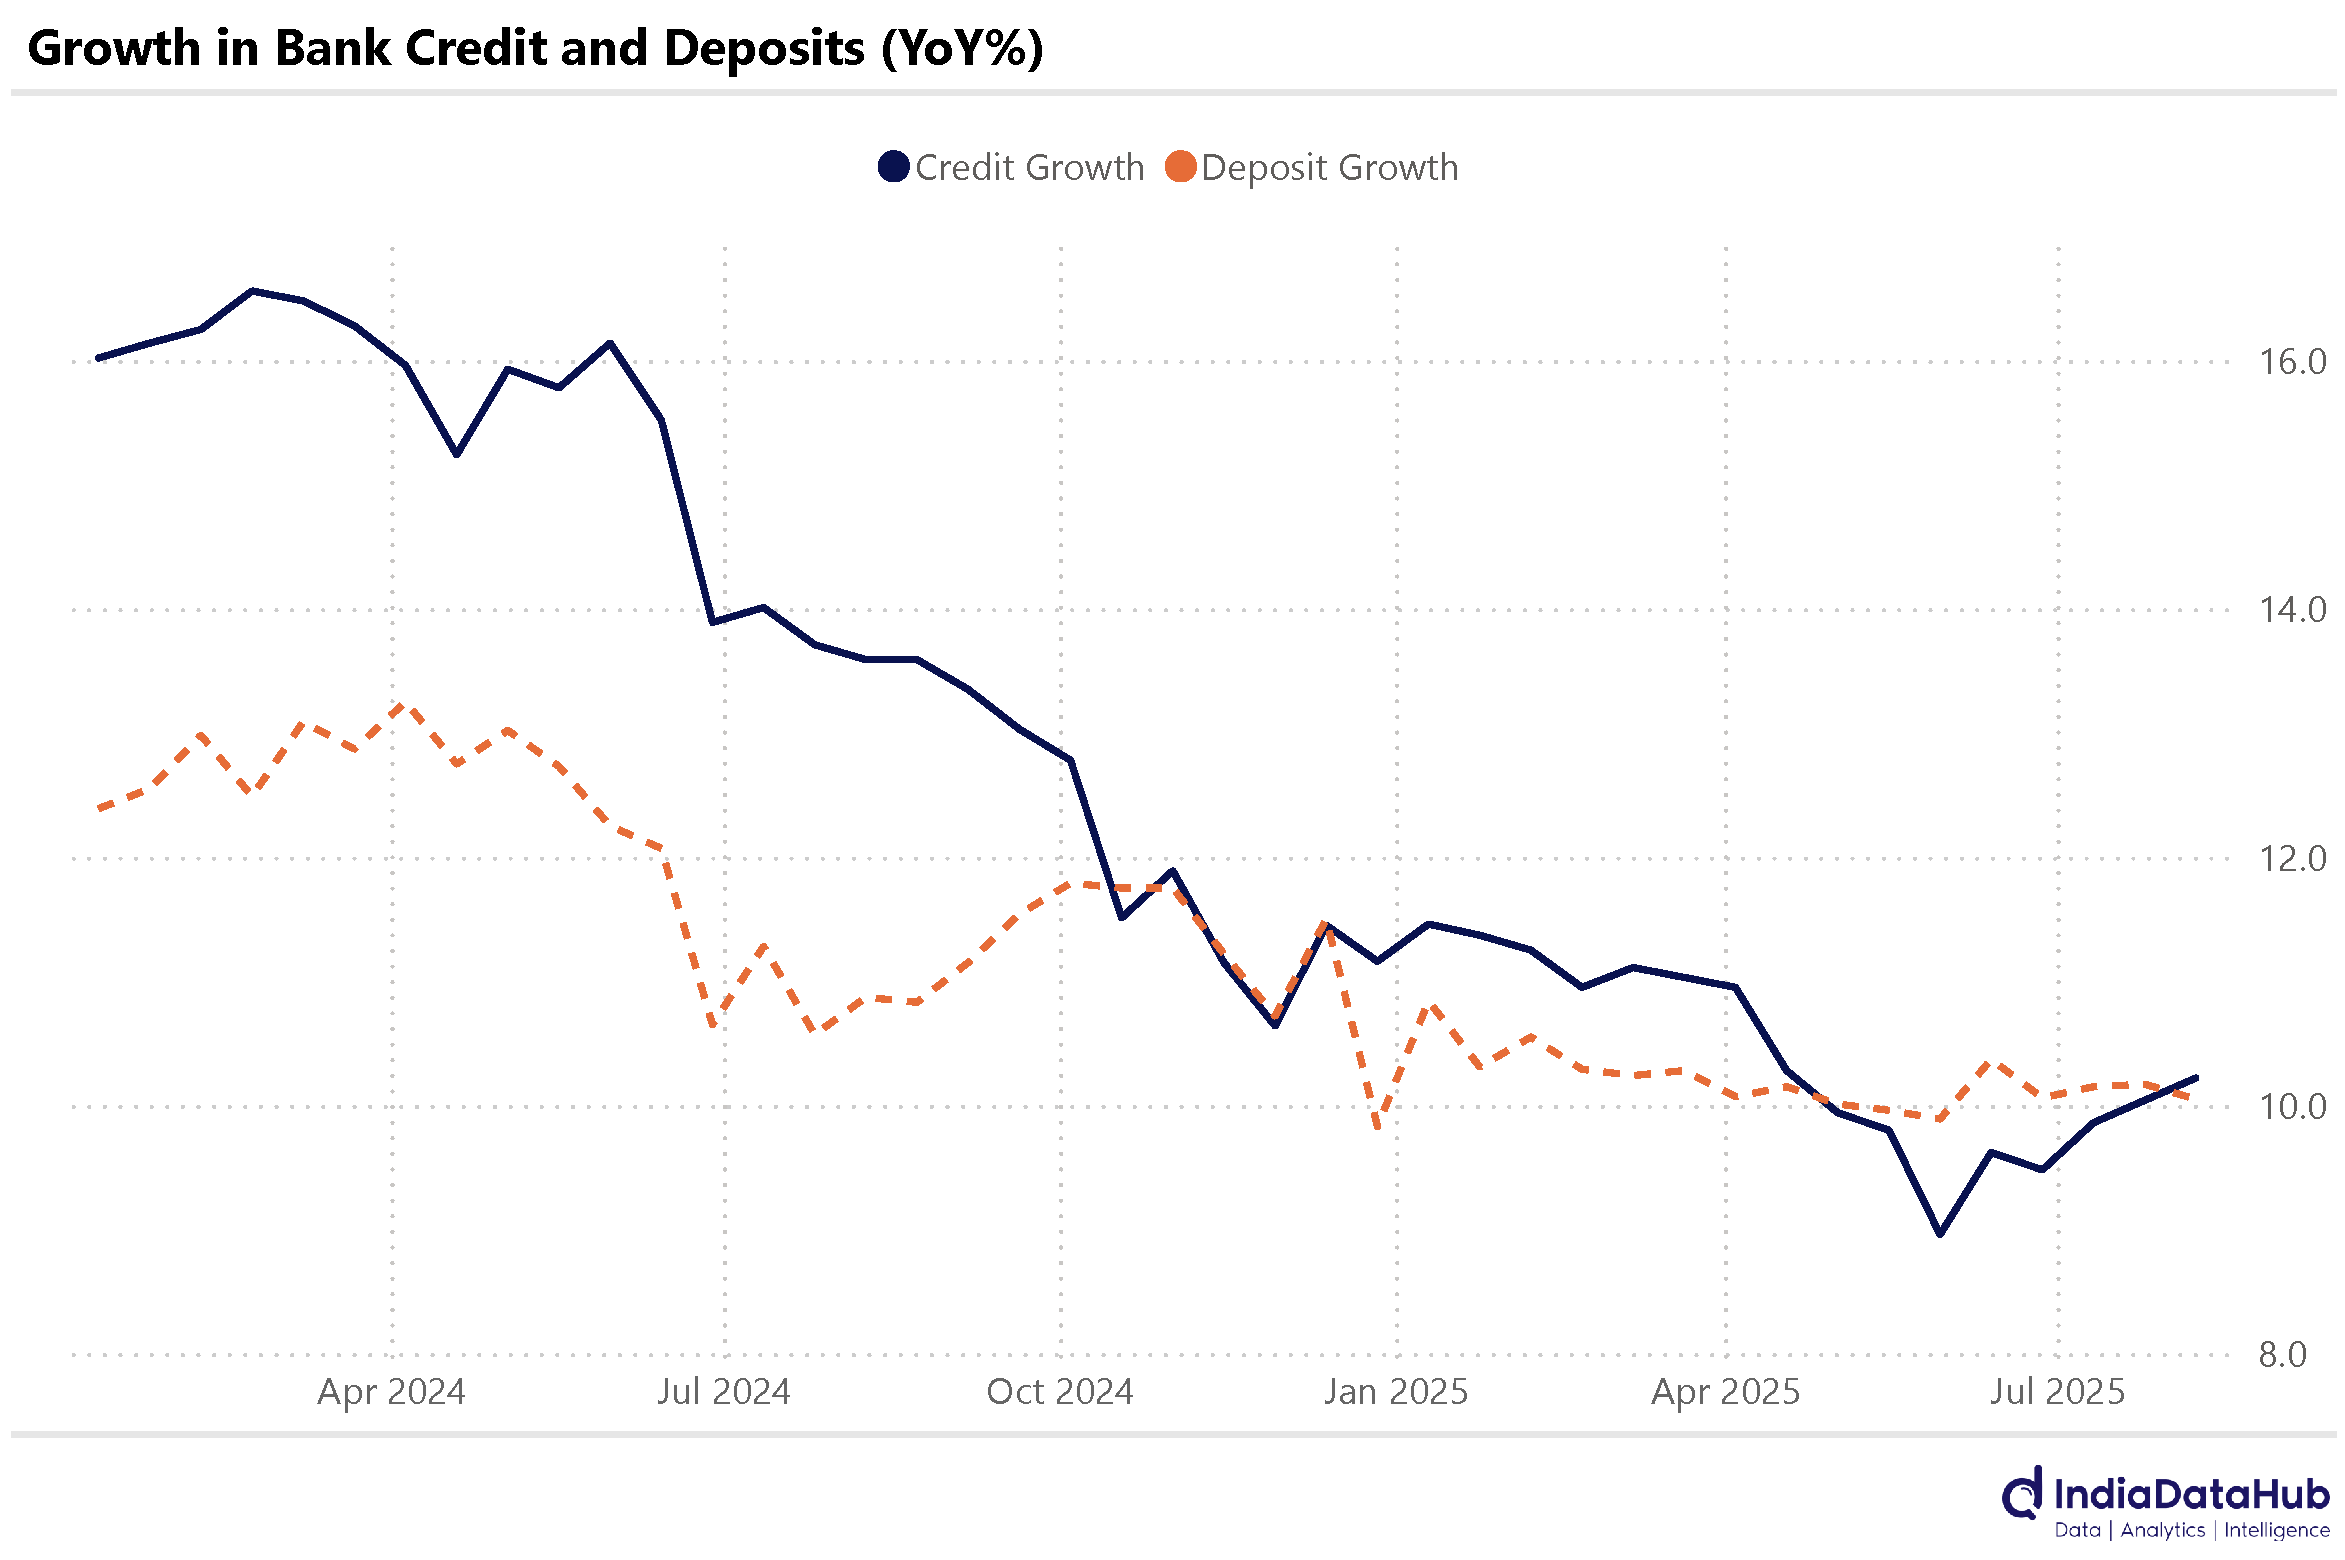
Credit and Deposit growth continues to remain subdued at ~10% YoY. In the first fortnight of August, Bank credit grew by 10.2% YoY, while overall deposits grew by 10.1% YoY. While credit growth has seen slightly uptick in the last couple of months, the big picture remains that credit growth has seen a sharp slowdown over the past few quarters – at the start of last year, bank credit was growing 6ppt higher at over 16% YoY. Consequently, while the LDR has not risen in recent months, it remains close to the all-time high of 80% implying there is little slack on bank balance-sheets.
A bunch of global trade data was released recently. And the story is broadly the same. Exports to the USA are dropping in double-digit terms pretty much across the board – China, Japan and Germany in this case.
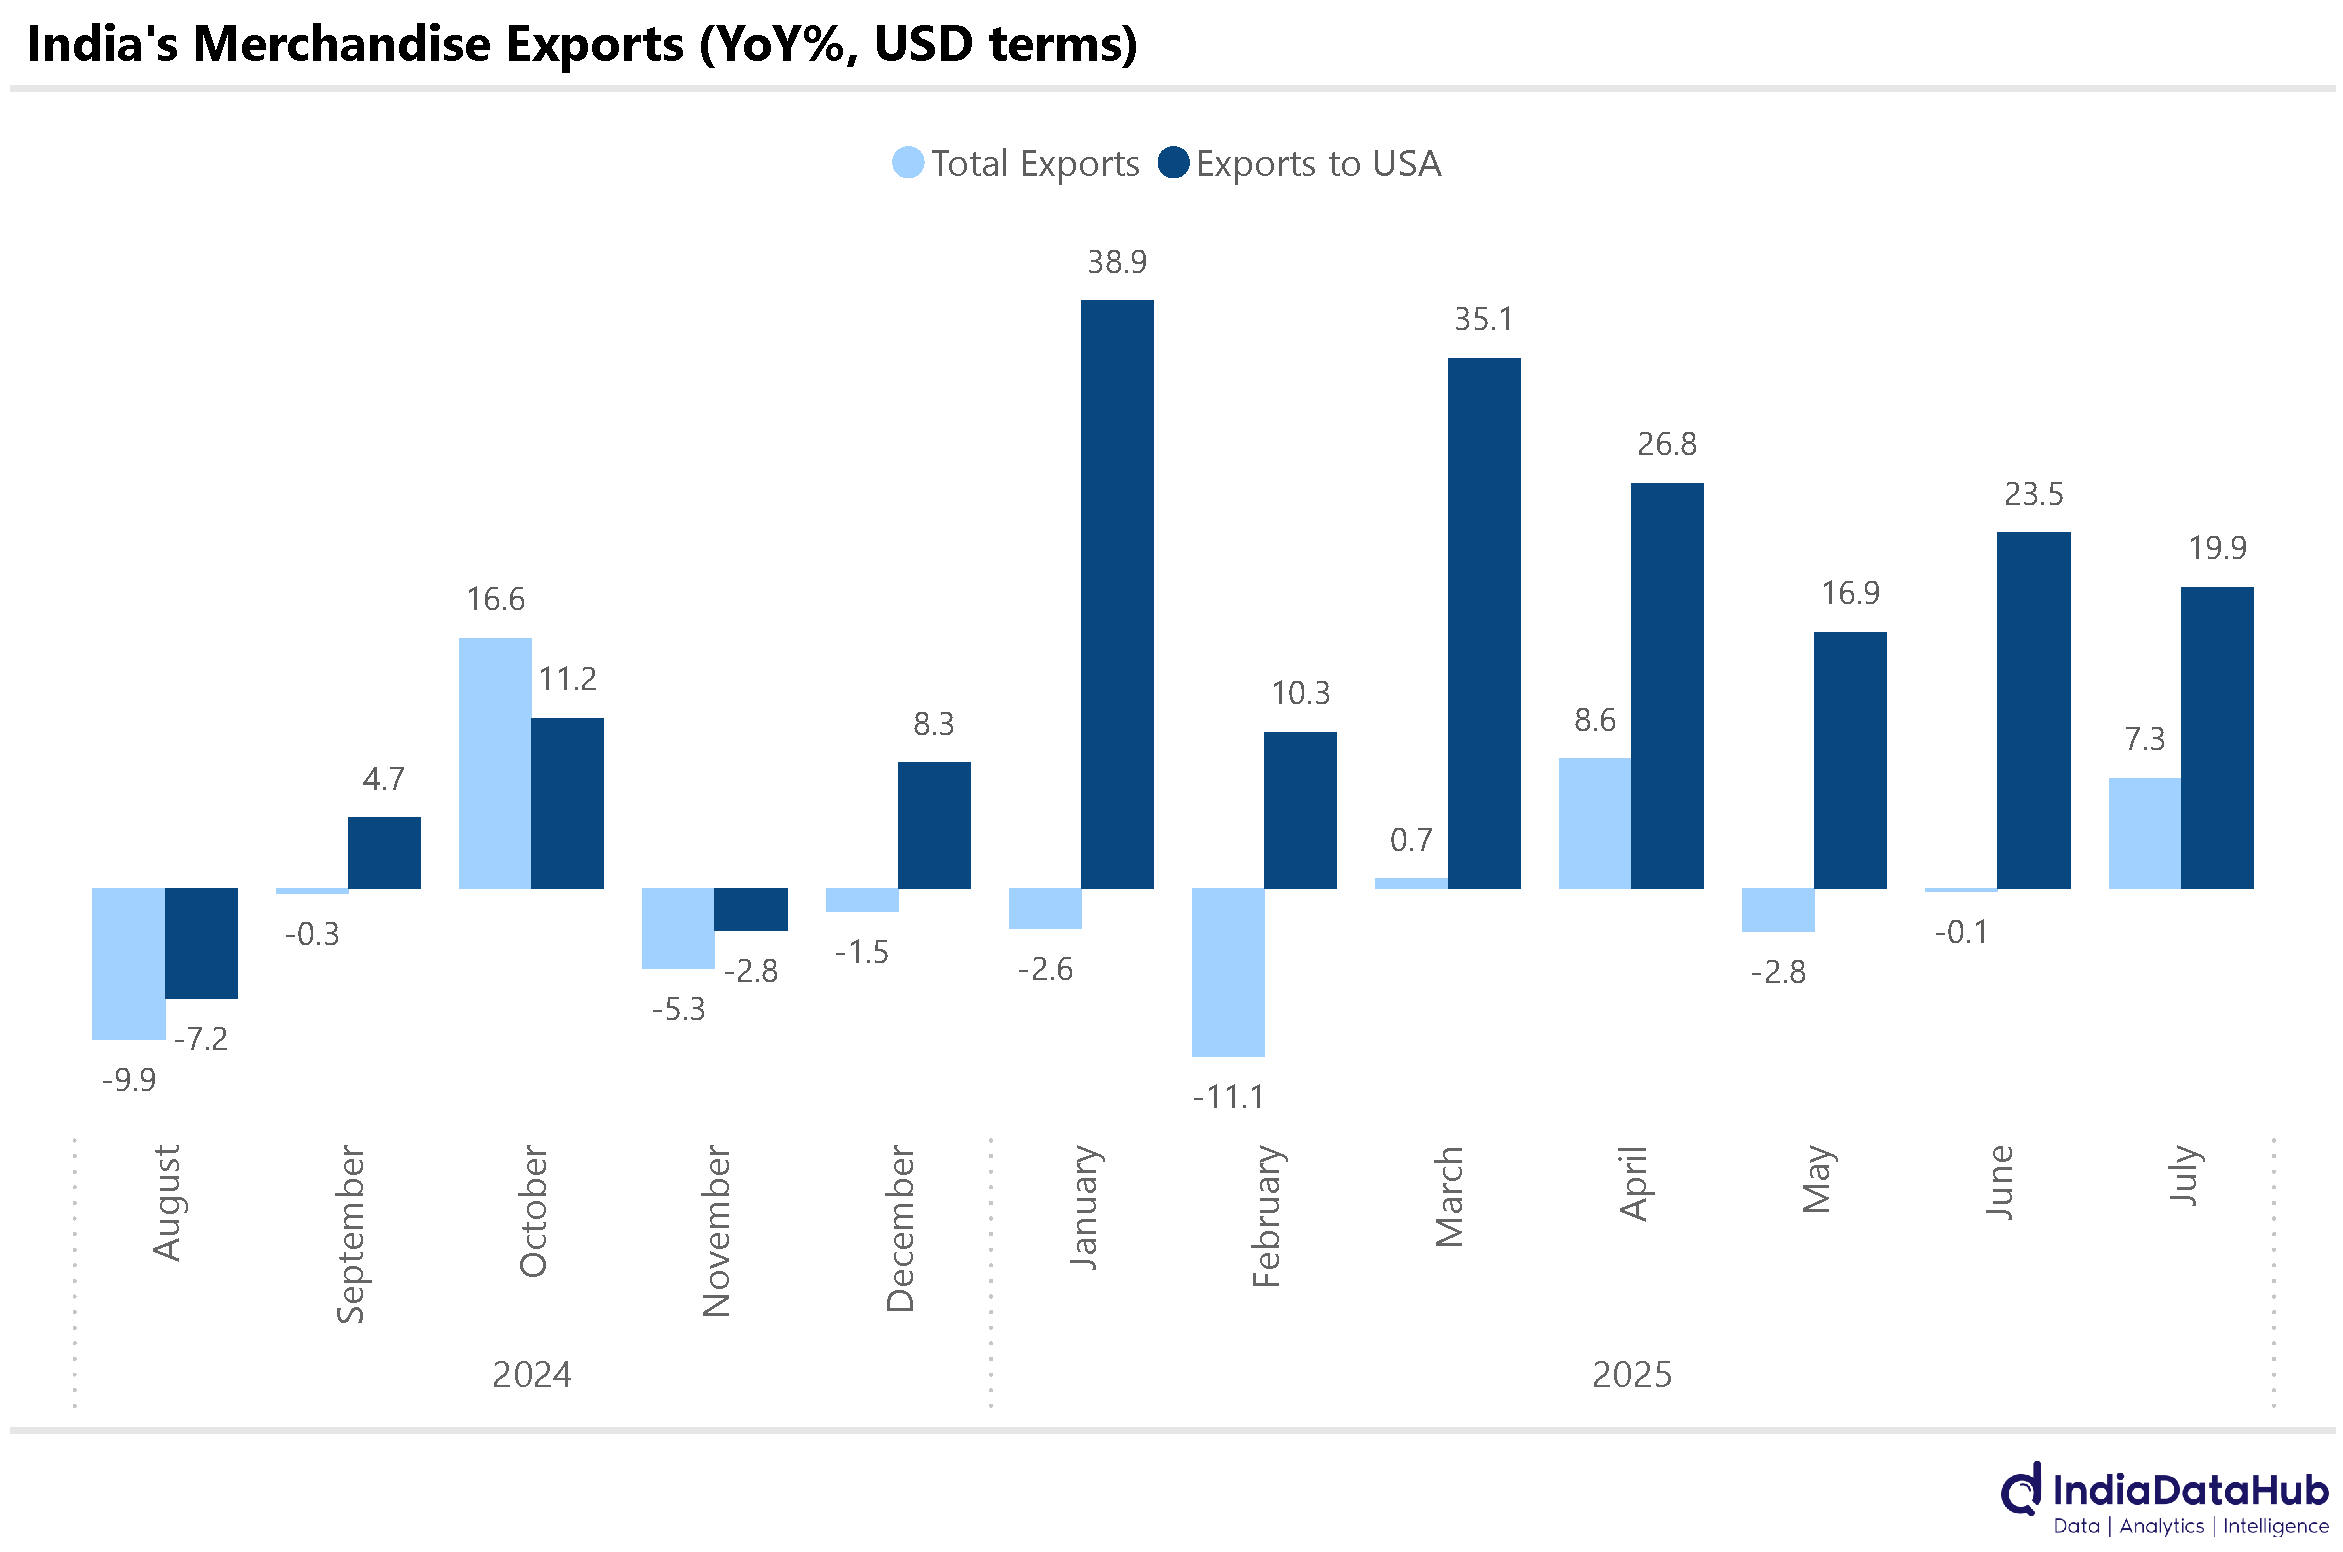
This contrasts with India, where exports to the USA were still rising sharply as of July. This is largely because tariffs on India are yet to kick in – they kick in from this month – and thus exporters are front-loading deliveries. August should see a sharp moderation in India’s export growth to the USA, and September should possibly see a large decline unless the tariffs are fully or partially rolled back.
In July 2025, China’s merchandise exports rose by 7.2% year-on-year to $321.78 billion, accelerating from June’s 5.8% growth. This increase was driven by strong demand for transport equipment (12.3%), machinery and electrical equipment (7.5%), and base metals (12.2%). Regionally, exports to Southeast Asia and the EU grew significantly, while shipments to the U.S. continued to decline, falling 21.6 % year-on-year. In contrast, exports to Vietnam rose sharply by 28.1 % year on year.
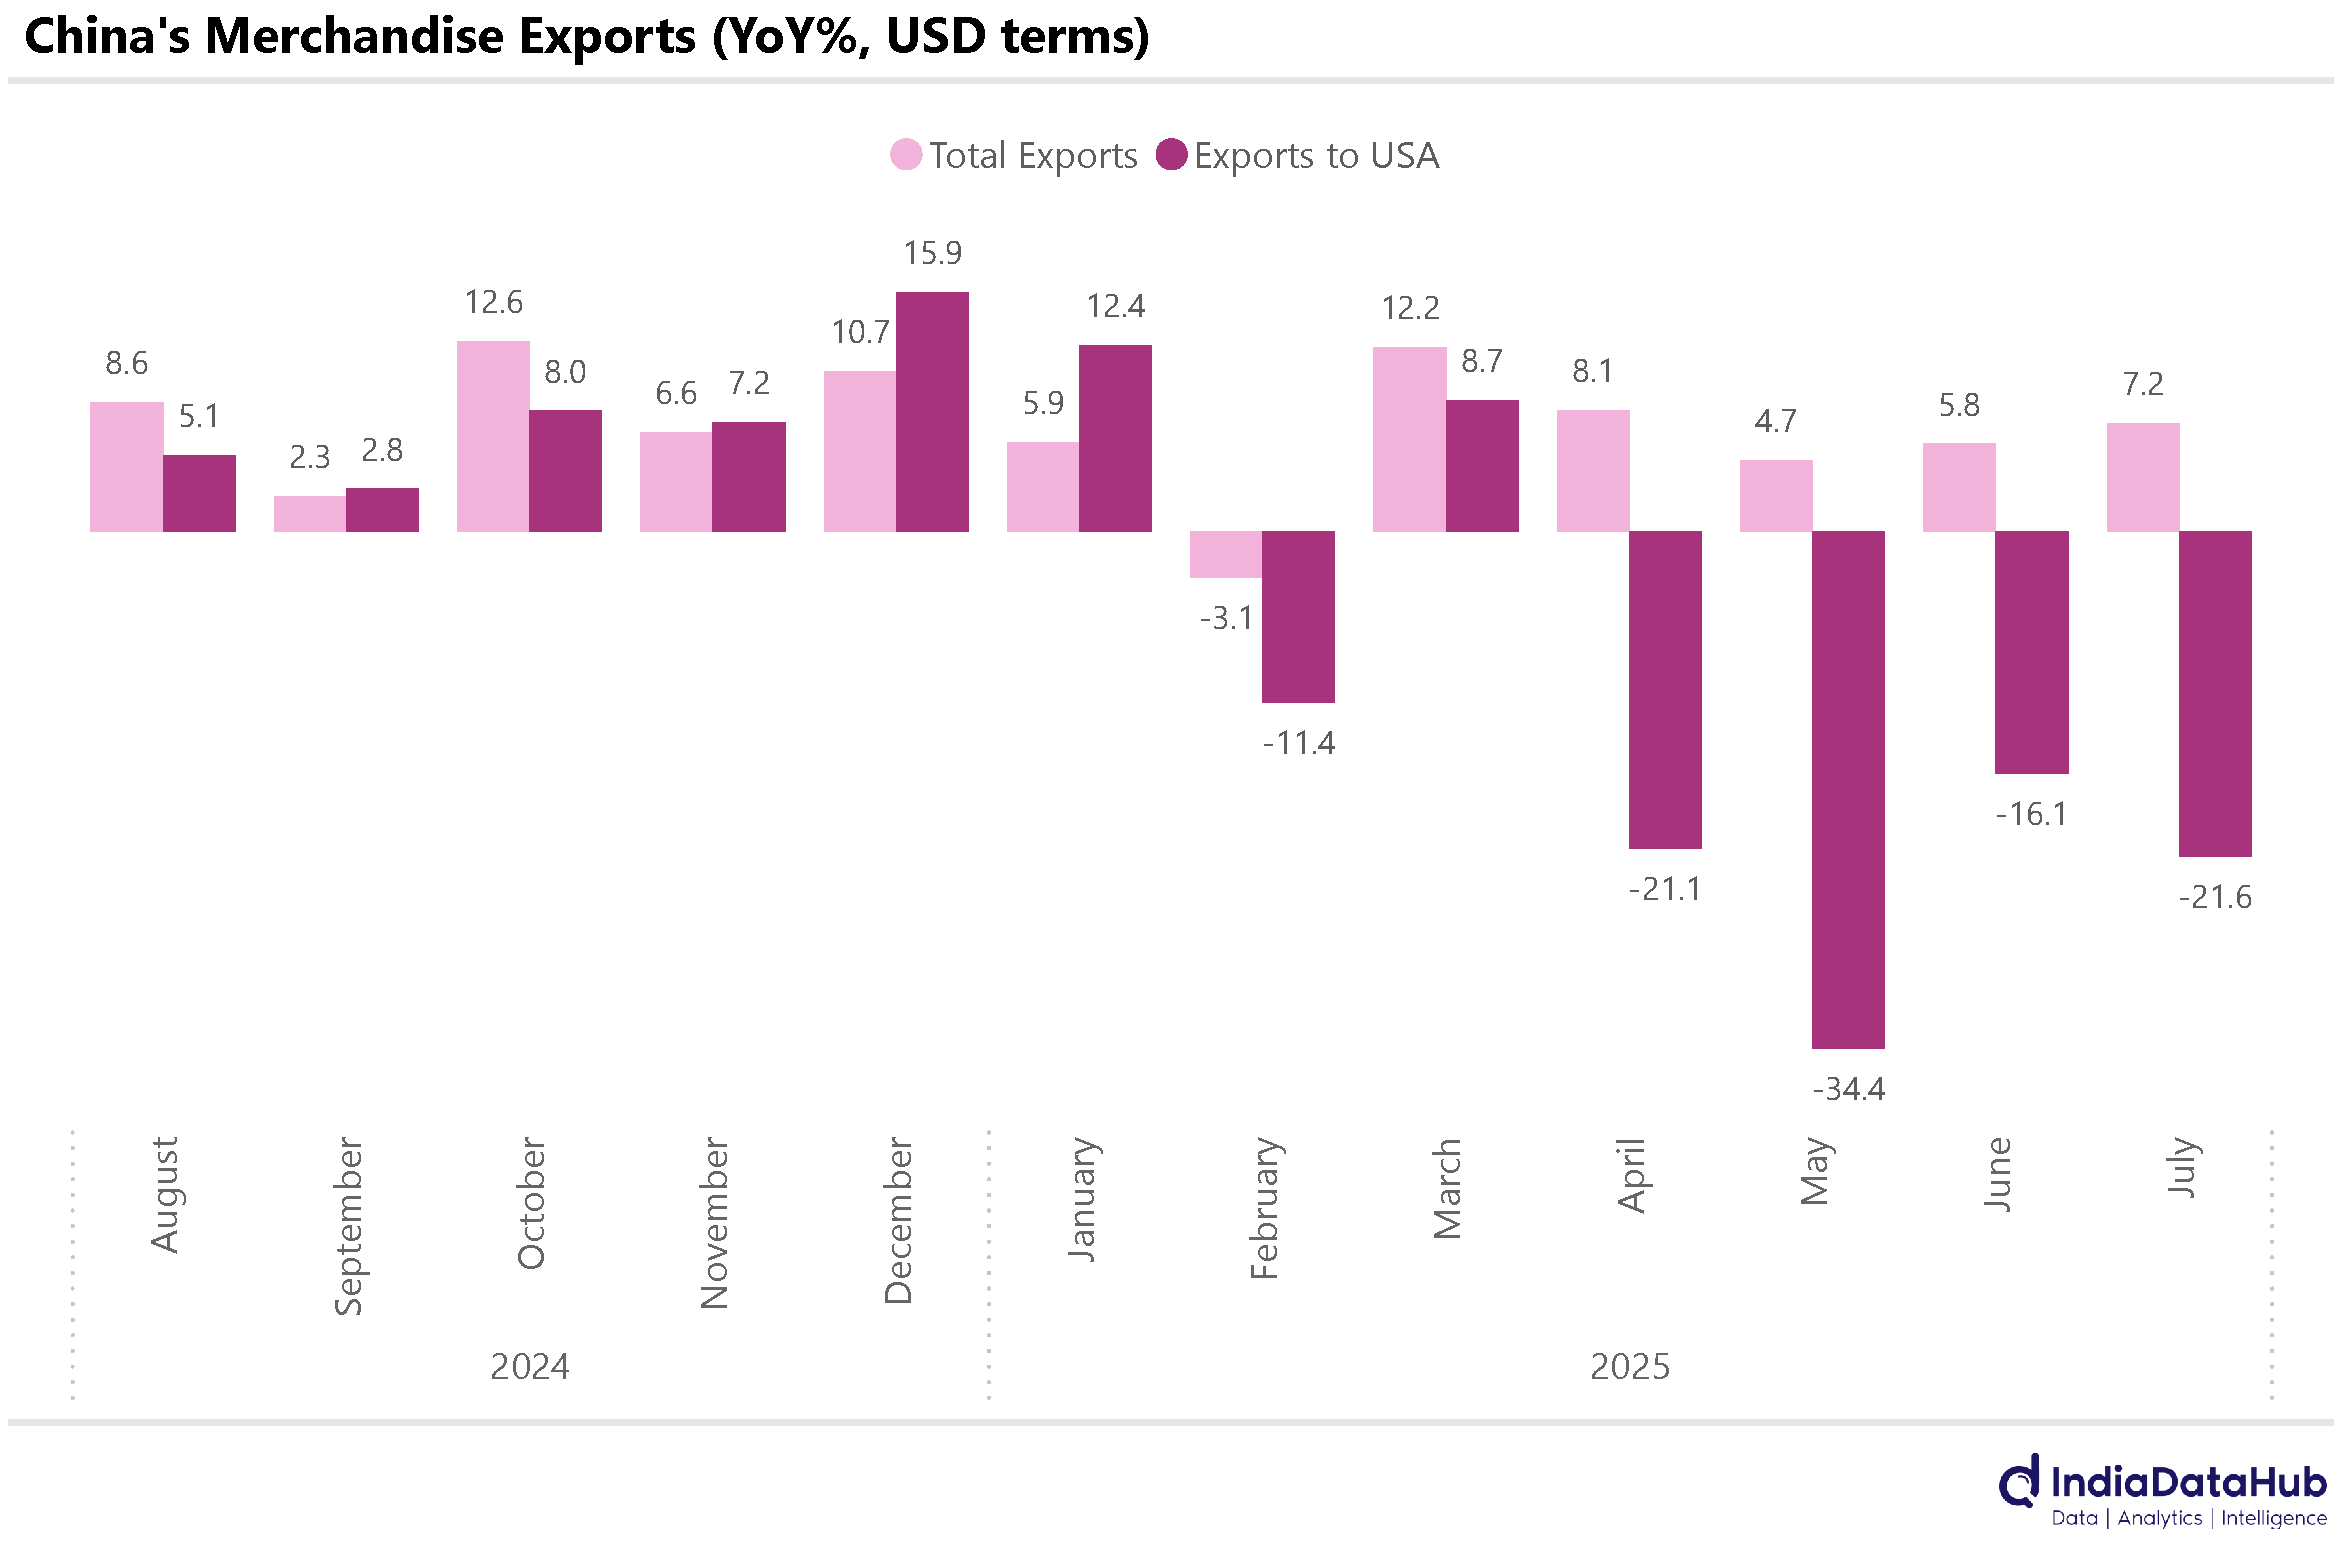
Imports also recovered rising 4% year on year to $223.54 billion — the fastest pace in a year. Regionally, imports from the U.S. dropped by 18.6% year on year, whereas imports from Hong Kong soared by 175.8% year on year. Although the trade surplus grew 14.9% year-on-year, it narrowed sequentially to $98.24 billion in July, down from $114.6 billion in June.
In July, Japan’s exports declined 2.6% year-on-year to ¥9.36 trillion, marking the steepest drop in over four years. The contraction was driven by reduced shipments to its two largest markets—the United States (-10.1%) and China (-3.5%)—while exports to Hong Kong rose 17.7%. By commodity, exports of chemicals (-7.3%), manufactured goods (-10.0%), and transport equipment (-11.5%) weakened, whereas machinery (+1.2%) and electrical machinery (+0.4%) posted modest gains.
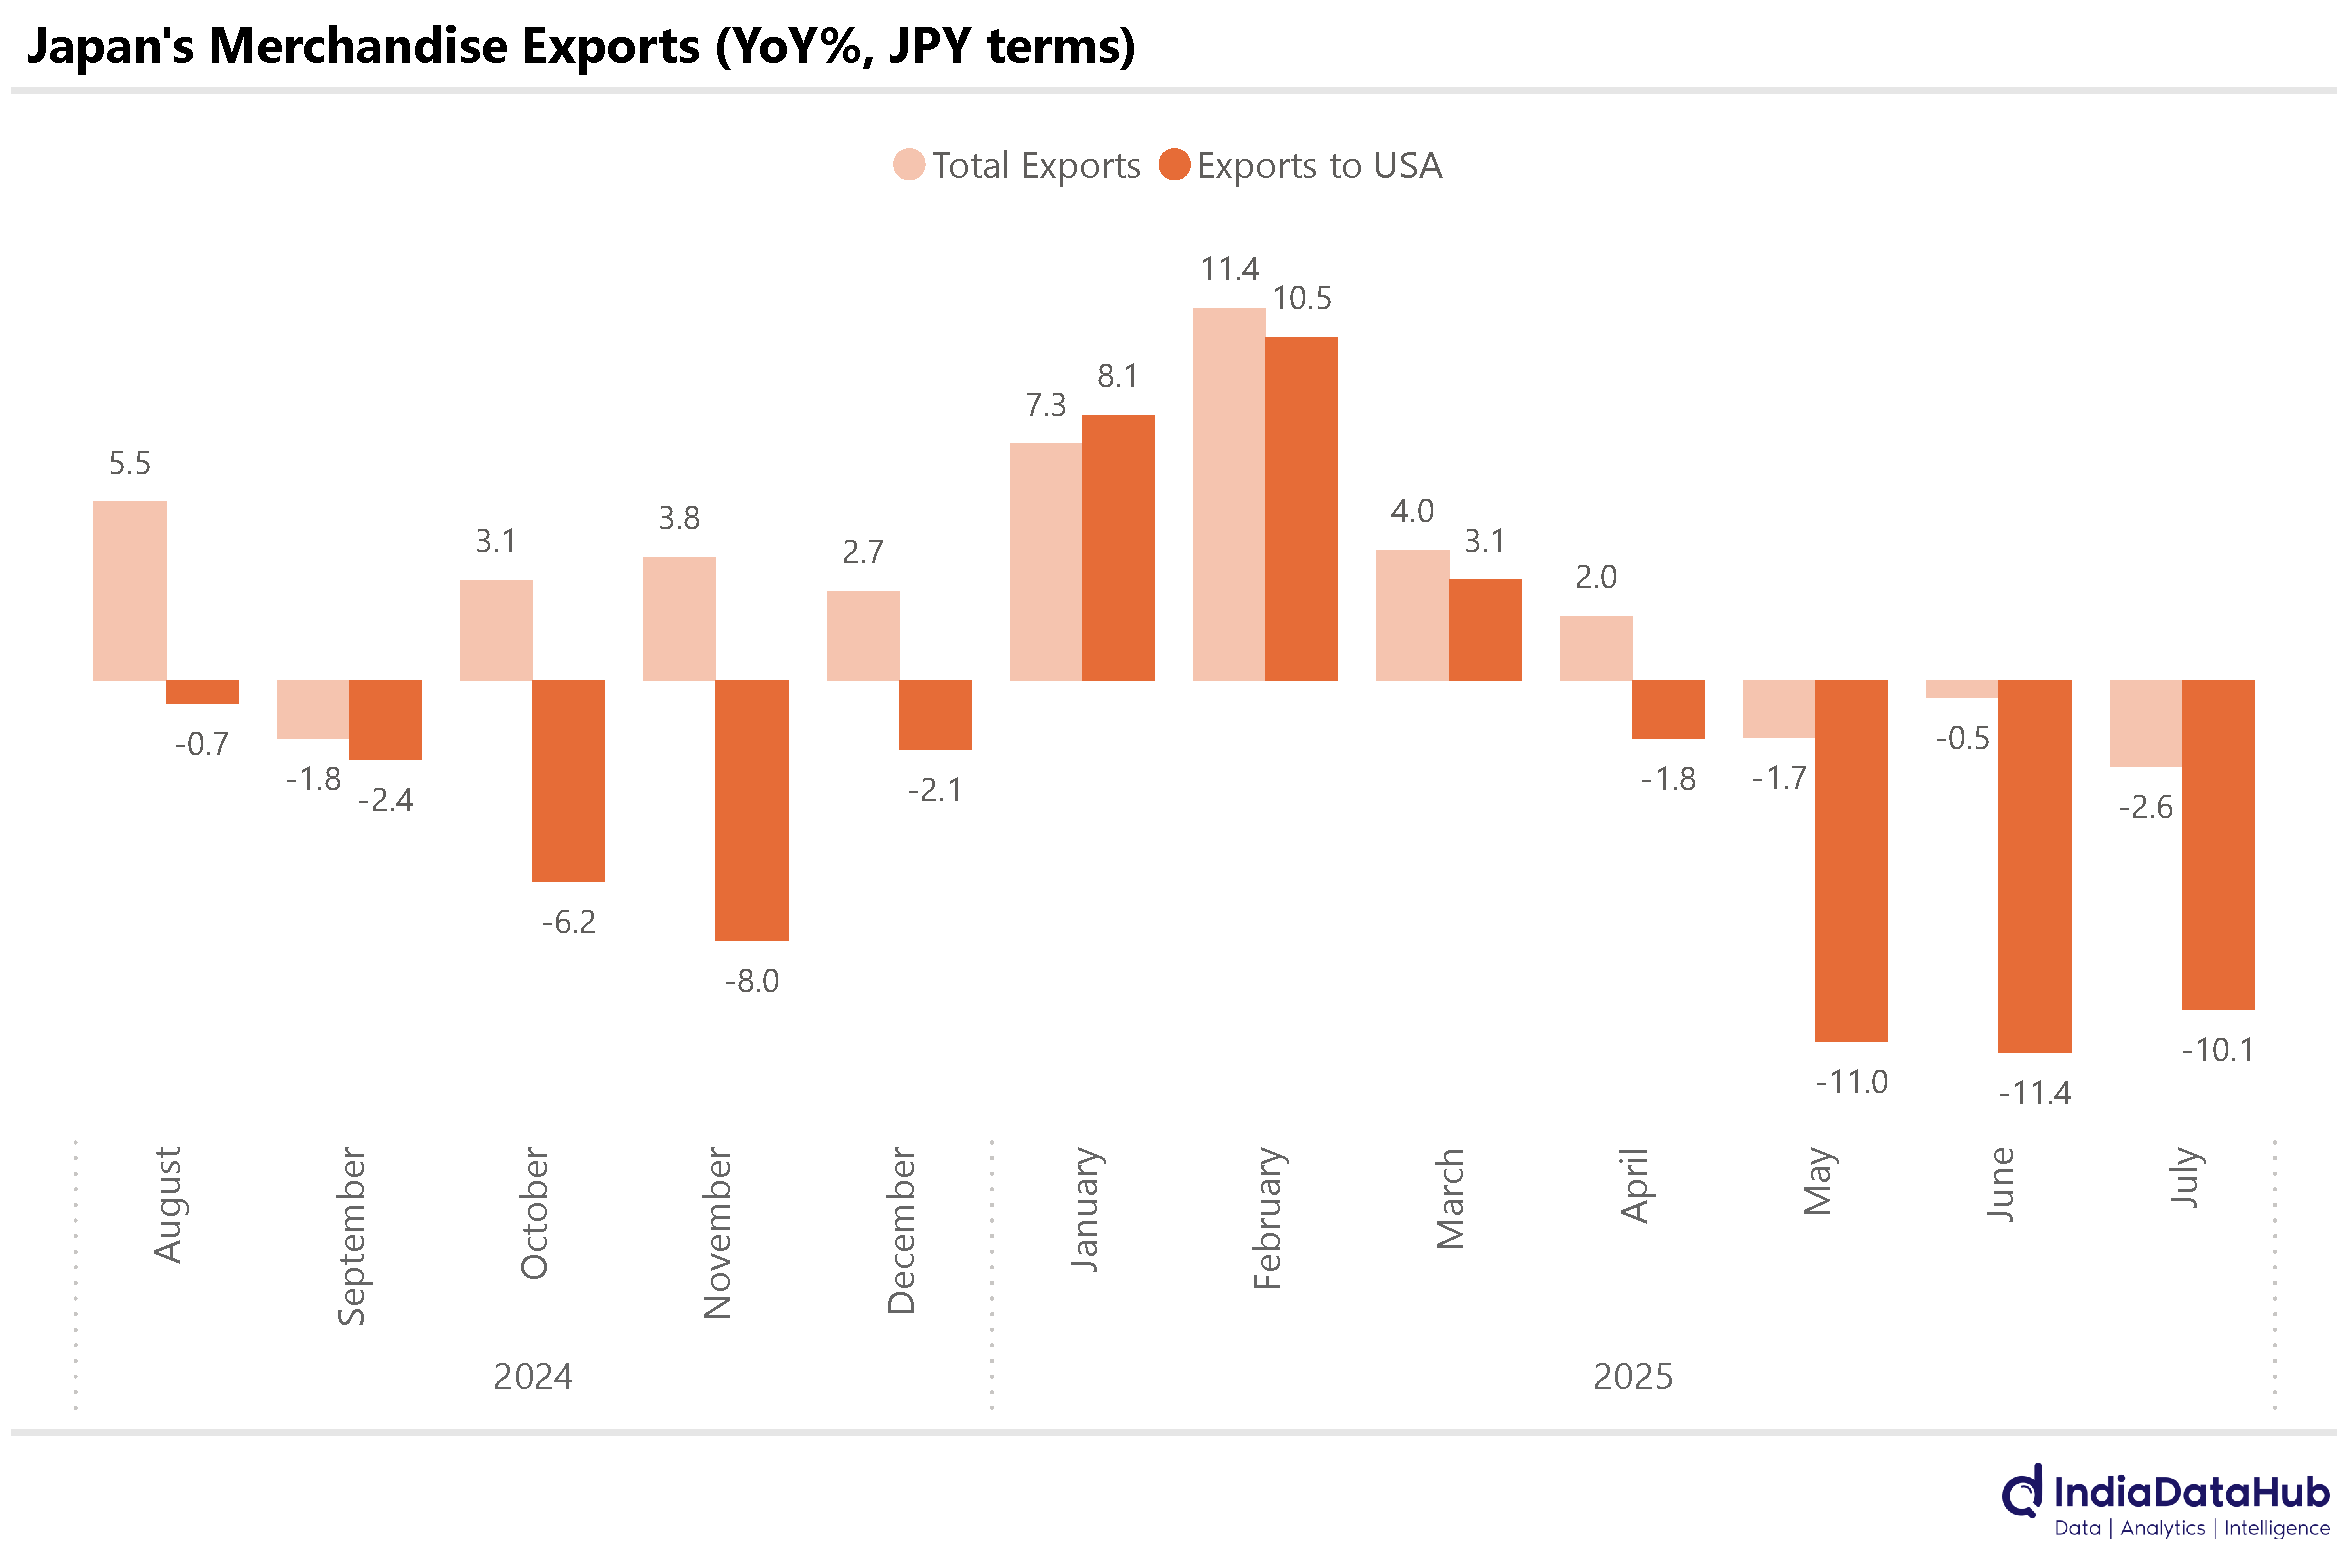
Imports also fell 7.5% year-on-year to ¥9.48 trillion, with declines from key trading partners including China, the U.S., South Korea, and Australia. In contrast, imports from Germany increased 9.1%. As a result, Japan recorded a trade deficit of ¥117.55 billion, sharply narrowing from ¥628.34 billion in the same period last year.
In June 2025, Germany’s merchandise exports edged up by just 0.1% YOY, rising from €128.49 billion to €128.67 billion (June data - yeah, Europe reports trade data with a lag). This modest increase was primarily driven by higher exports of food products, while key sectors such as chemicals, manufacturing materials, machinery, and transport equipment saw declines. On a country level, exports to France rose significantly by 9.4%, whereas shipments to China and the United States dropped sharply, falling by 14.2% and 11.1%, respectively.
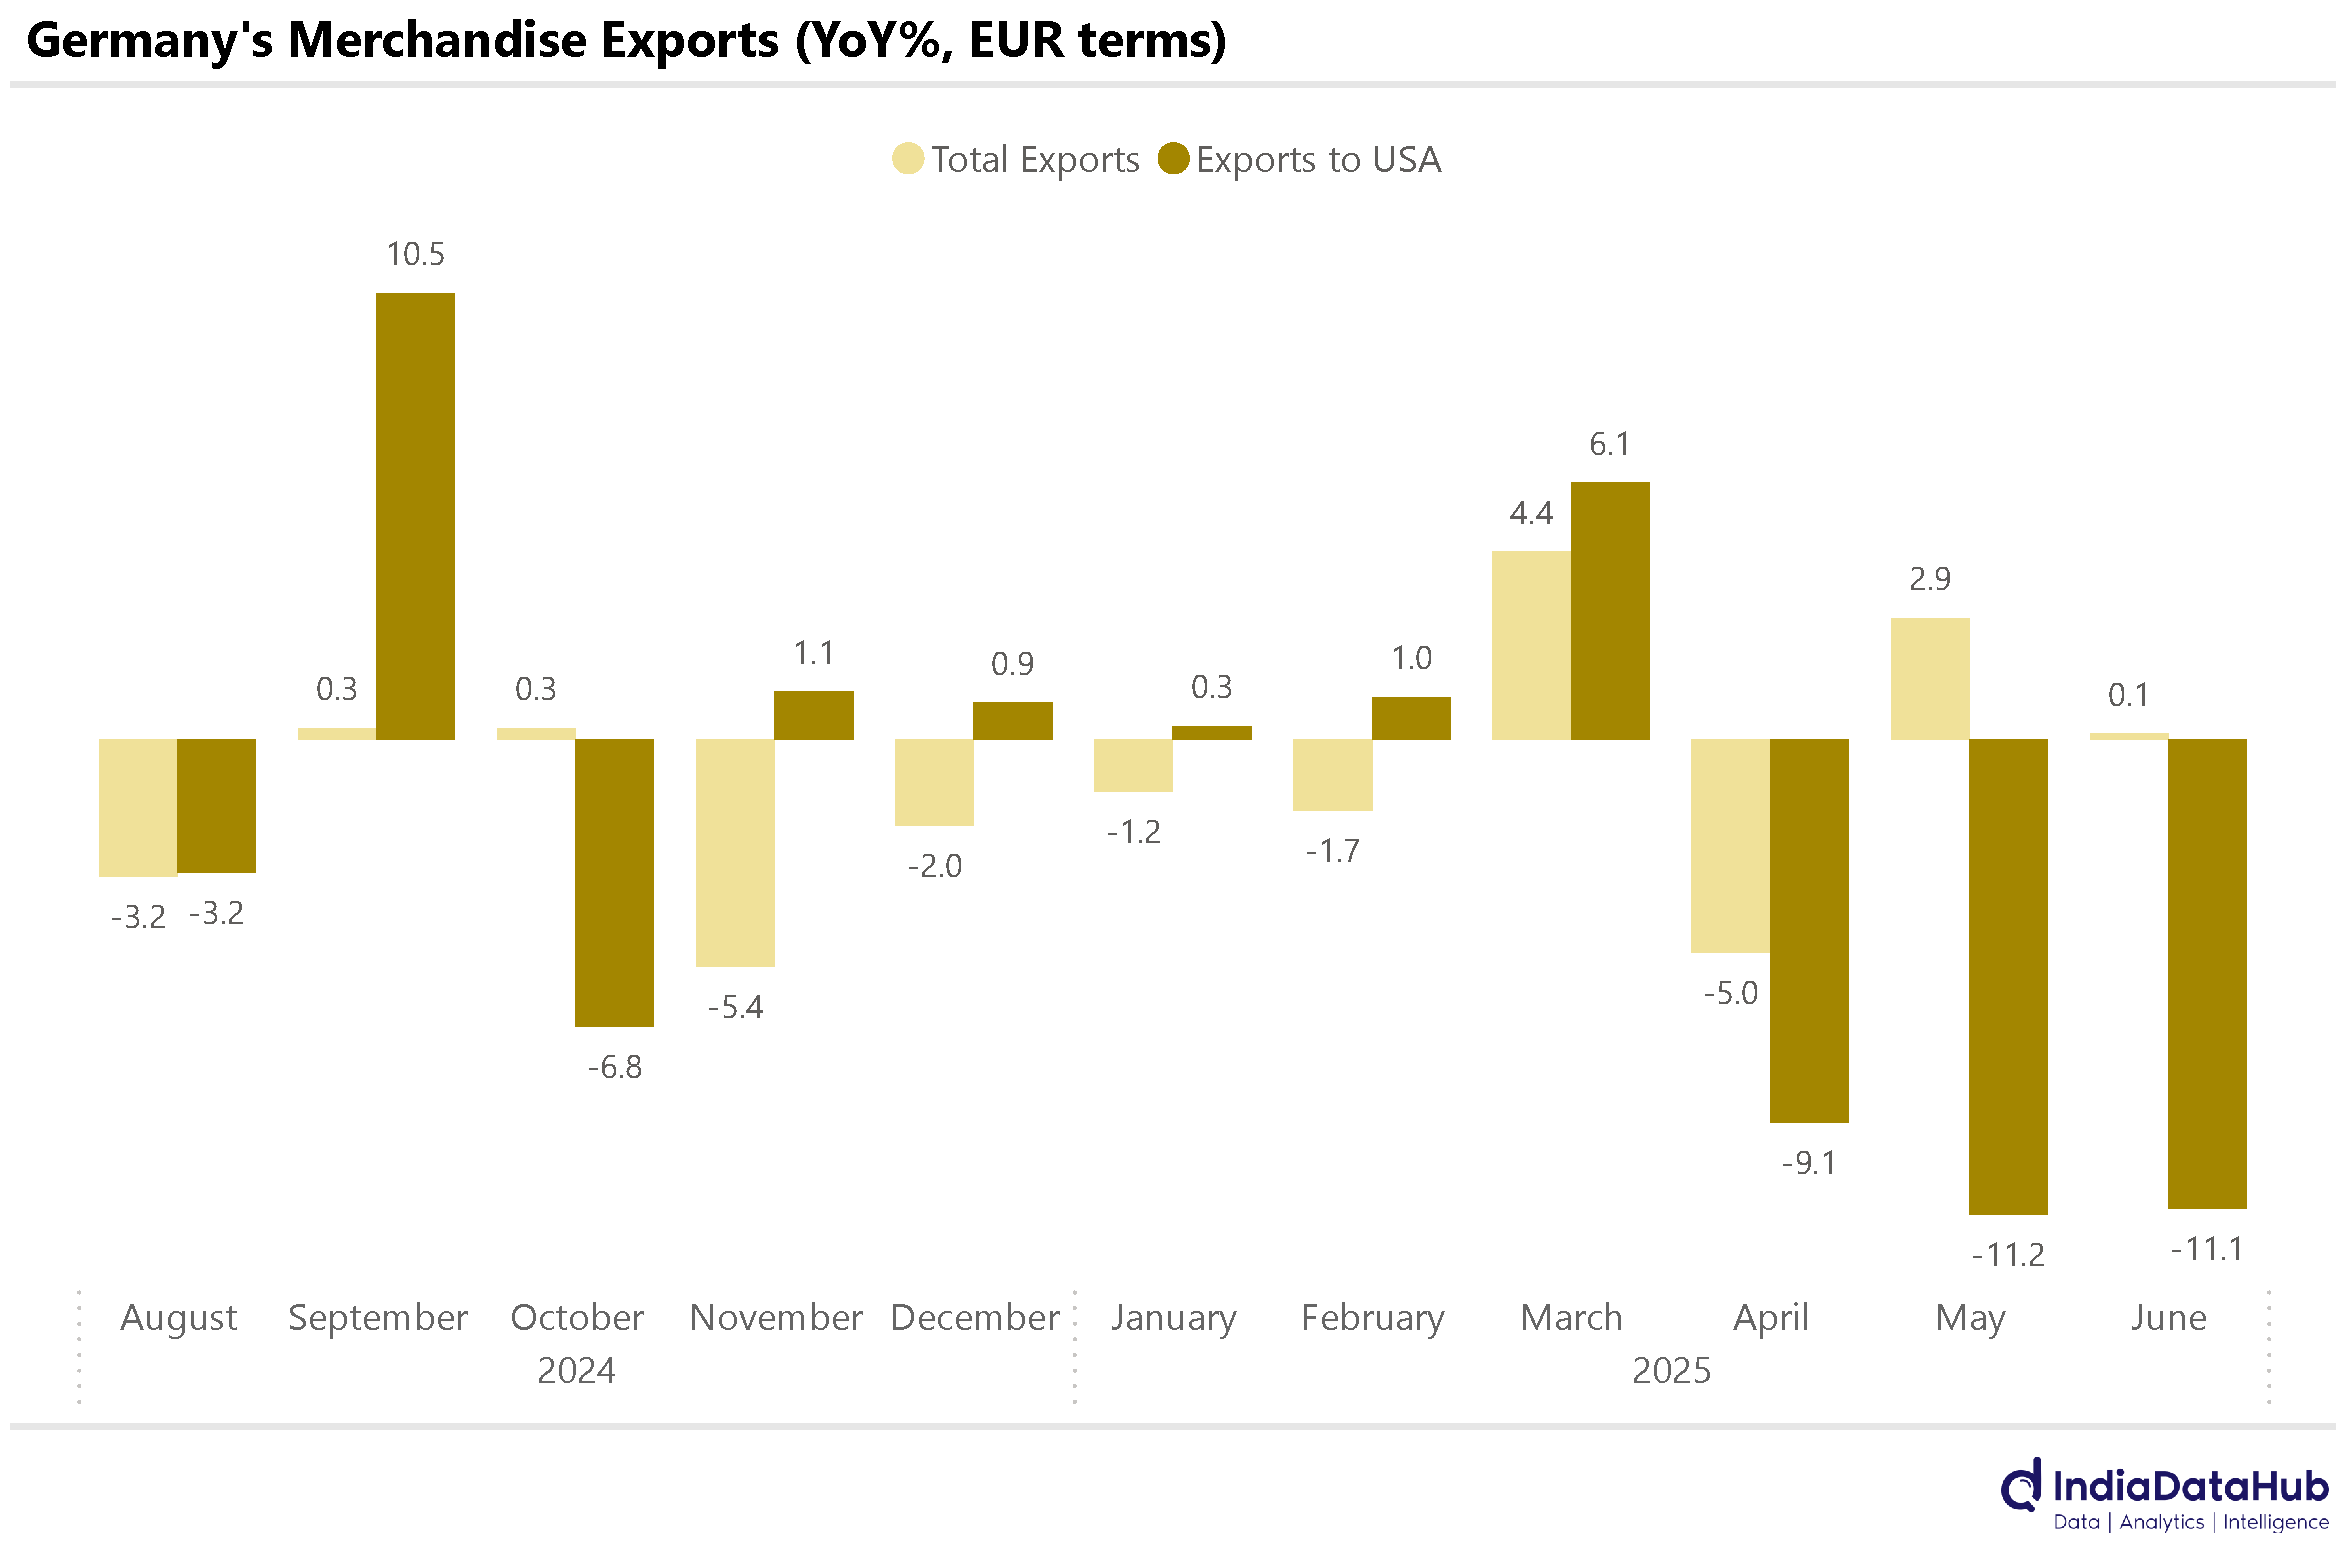
Imports, on the other hand, grew more robustly—up 5.9% YoY to €113.16 billion from €106.87 billion. Country-wise, imports from China rose by 11.4%, and imports from the United States rebounded strongly—up 17.7%, reversing a 6.7% decline recorded in May. As a result of slower export growth and stronger import demand, Germany’s trade surplus narrowed by 28.3% YoY, falling from €21.62 billion to €15.51 billion in June.
That’s it for this week. See you next week…