
Airlines outperforming Railways, Demon 2.0, Job creation and more...
This Week In Data #19
In this edition of This Week In Data, we cover:
Domestic Airlines are outperforming Railways in terms of passenger traffic coming out of Covid
The impact of demon 2.0
Formal job creation was strong in FY23
Upward revision in 2022-23 crop production
Fixed line operators continue to add subscribers
In case you missed, we released the first of our thematic reports. In this inaugural Thematic Report, we delve into the Mutual Fund industry, focusing on the remarkable growth witnessed by passively managed funds in recent years. Over the past four years, passively managed funds have received nearly double the net inflows compared to actively managed funds. The EPFO has played a crucial role in the growth of passive funds. However, despite its substantial inflows, EPFO’s flows represent less than half of the total inflows into the passive funds. Individual investors are increasingly contributing to the growth of passive funds. As of March 2023, individuals held 20% of the AUM of passive funds, and this share has doubled in the last 4 years.The pandemic seems to have structurally changed people’s travel preferences. Domestic aviation traffic for example is now running above the pre-pandemic levels. However, the passenger traffic at the Railways continues to run well below the pre-pandemic level.

In the last three months (Feb-Apr) for example, the total number of passengers carried by the domestic scheduled aircraft operators was almost 13 million per month. This is 12% higher than the passenger traffic during this period in 2019. During the same period however the passenger traffic of Indian Railways is almost 20% lower. And the decline is more in the case of long-distance passengers (non-suburban traffic) than suburban passengers. The non-suburban passenger traffic is running over 20% below the pre-pandemic level. So, either the segment that used to travel by Railways is not travelling as much as they used to, or they have substituted the Railways by either Road or Airlines.
We missed commenting on Demonetisation 2.0 in last week’s edition as we jumped the gun in sending the edition out. A lot has been written about it so we do not want to add to the noise. Suffice it to say that we are squarely in the Demon 2.0 is ‘much ado about nothing’ camp. But in this whole discussion about demonetisation one point that does not get mentioned, is how little we (analysts, sitting in air-conditioned offices) understand about the currency in circulation. For, despite demonetisation 1.0 and the massive increase in digital payments, currency in circulation as of today is 12% of GDP, the same level (slightly higher, if one were to nit-pick) as it was just before demonetisation 1.0.
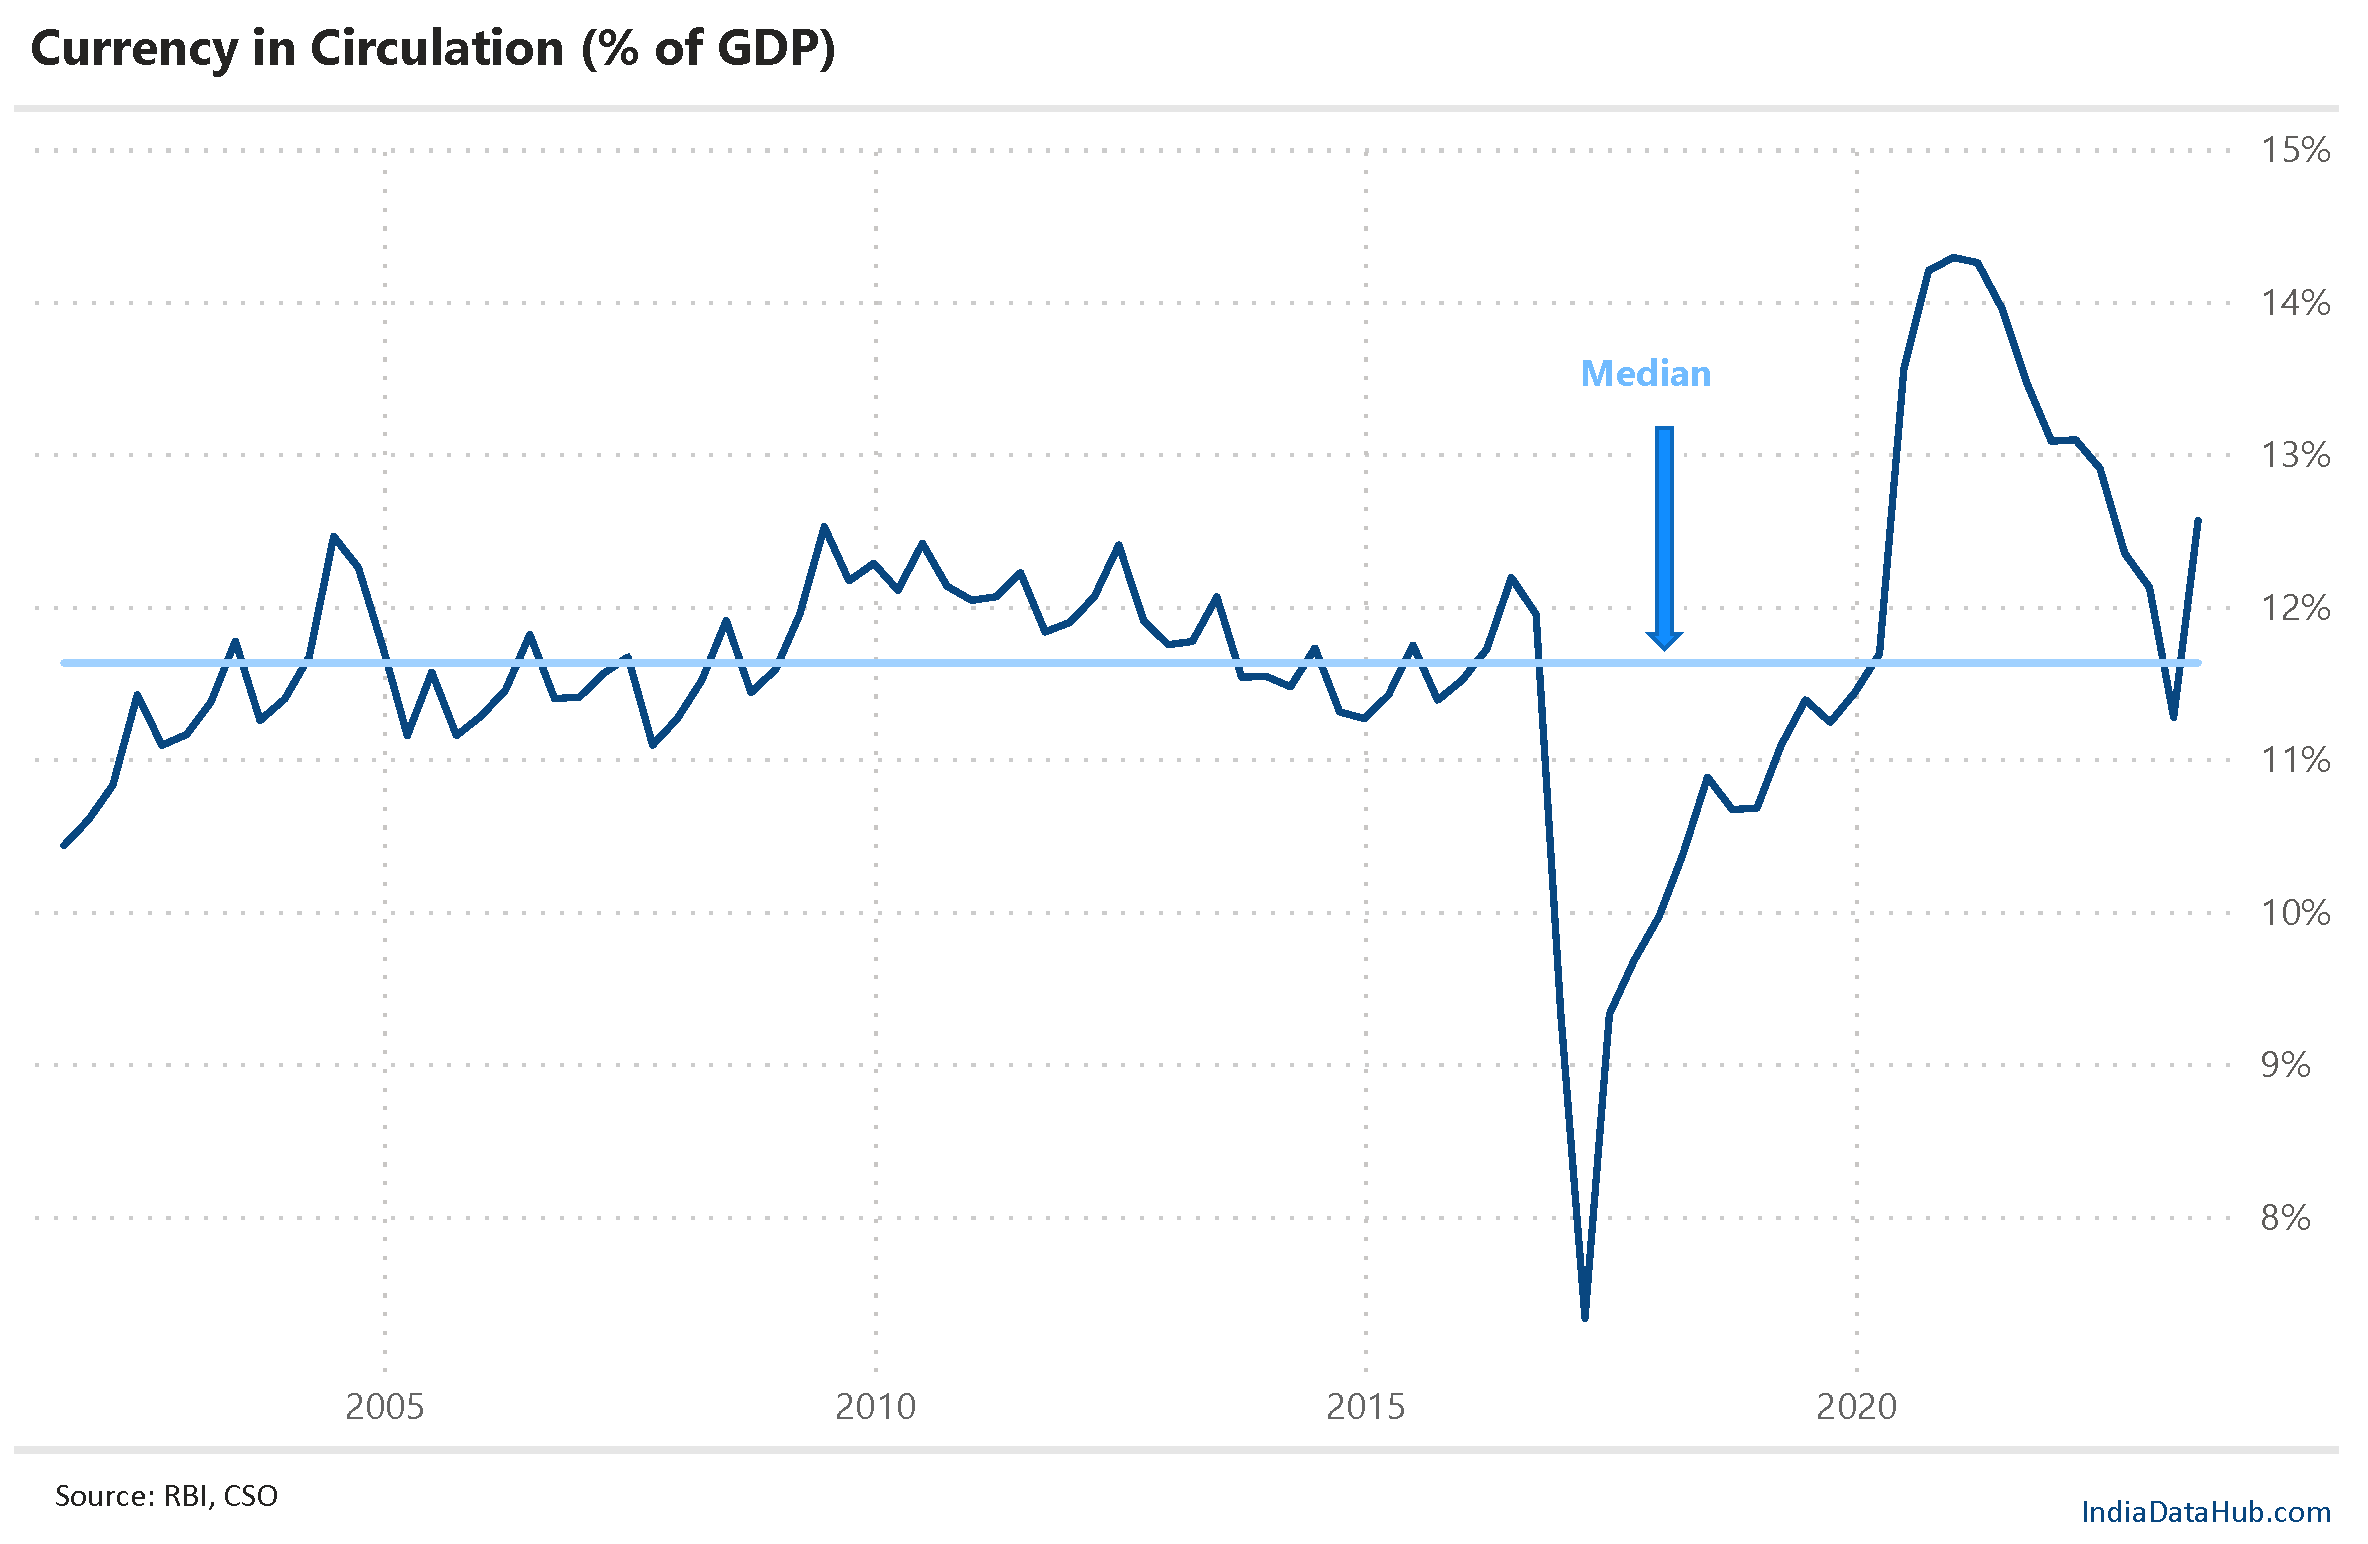
But it will be interesting to watch how currency in circulation moves over the next few weeks. The latest data, released this week, is as of Friday the 19th May, the day Demon 2.0 was announced. As of 19th May, currency in circulation was ₹35,800 trillion having grown 7.8% YoY.

As we wrote here, FY23 was a strong year for formal job creation in the country. As per data released this week, the EPFO saw a net addition of almost 14 million subscribers in FY23. This is almost 15% higher than last year. We will get the quarterly PLFS data about the employment situation in urban areas for 1Q next week. It will be interesting to see if that corroborates the EPFO data.
The government yesterday released the third advance estimate of crop production for the crop year 2022-23. The data as per the second advance estimate was released in February. As an FYI, the annual crop production data is subject to 4 advance estimates and then a final number. We are currently at the third advance estimate.

Anyways, the 3rd advance estimate saw an upward revision to the crop production estimate. Foodgrain production is now estimated at 330 million tonnes. The previous estimate was 324 million tonnes. Almost the entire upward revision is in Rice and Coarse cereals. Pulses have also seen a modest 1% upward revision in production. Non-foodgrain crops have seen a bigger revision in production estimates than foodgrains. Sugarcane & Jute have both seen over 5% increase in production estimate while Cotton and Oilseeds have seen a 2% increase in production estimate. At the margin, the upward revision to Sugarcane production is a positive given that sugar prices internationally are currently running 20% higher on a YoY basis.

The TRAI released the telecom subscription data for March earlier this week. What is interesting is to note how the subscriber growth is diverging for the last few years. In the last 5 years (FY19 – FY23), wireless operators have almost 40 million subscribers. Fixedline operators though have seen a sharp growth in the last few years. In just the last 2 years they have seen over 8 million subscriber additions on a net basis which is a 40% increase in its base. And this growth is largely coming from the poorer states. The number of Fixedline subscribers as of March is at a 9-year high.
That’s it for this week. More next week! Have a good weekend everyone…