
Bond Indices, Household Savings, Fed Watch and more...
This Week In Data #36
In this edition of This Week In Data we discuss:
Implications of India’s inclusion in the bond indices
The fall in household financial savings
Low overall Savings rate in India
Fed’s own ‘hawkish pause’
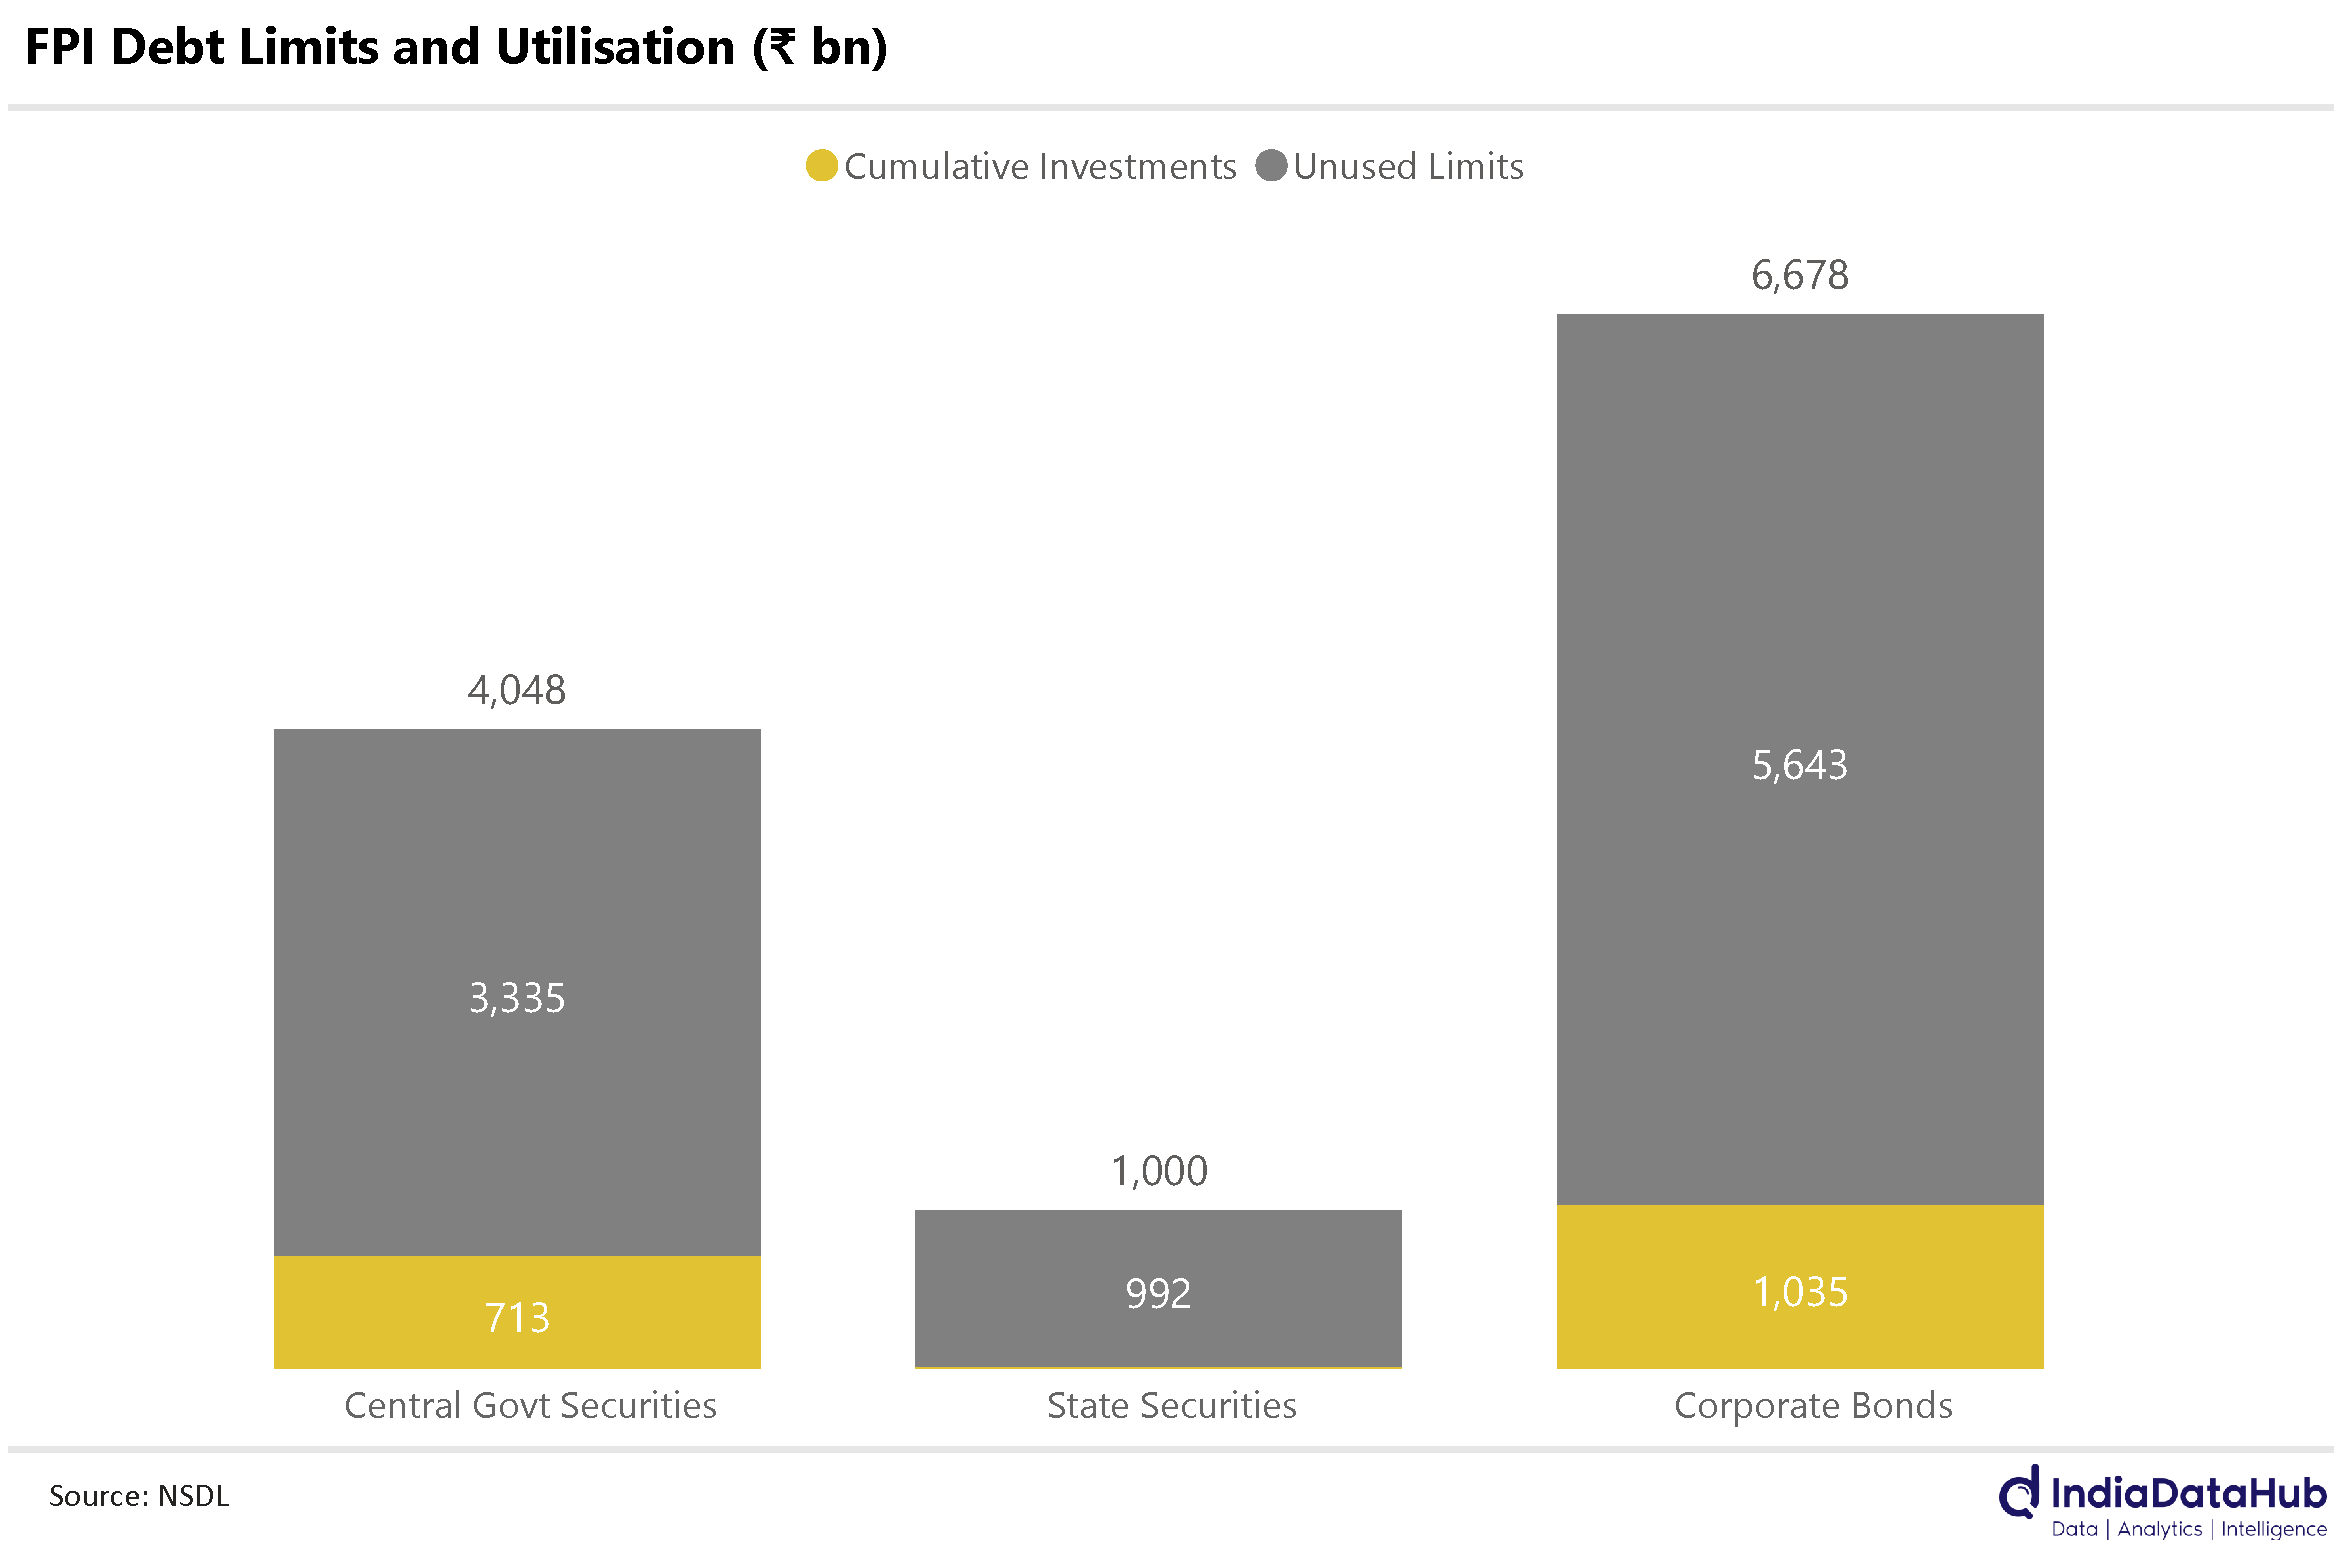
In case you missed, we released the 4th financial market dashboard this week. The currency dashboard tracks the performance of over a dozen currencies, including rupee cross rates, every day! You can get a quick overview from hereSo, India gets into the global bond indices. Ahoy! This is expected to increase the capital flows into India and specifically the government securities market. While the government has allowed foreign investors to buy Central government securities of up to US$50bn, cumulative investments to date are less than 20% of this limit. Foreign investors can currently invest an additional US$40bn in central government bonds. In addition, there are unused limits of almost US$70bn in corporate bonds. So, the inclusion in bond indices will perhaps make foreign investors use some of these unused limits – either due to them being benchmarked to those indices or just the added conviction that this inclusion provides.
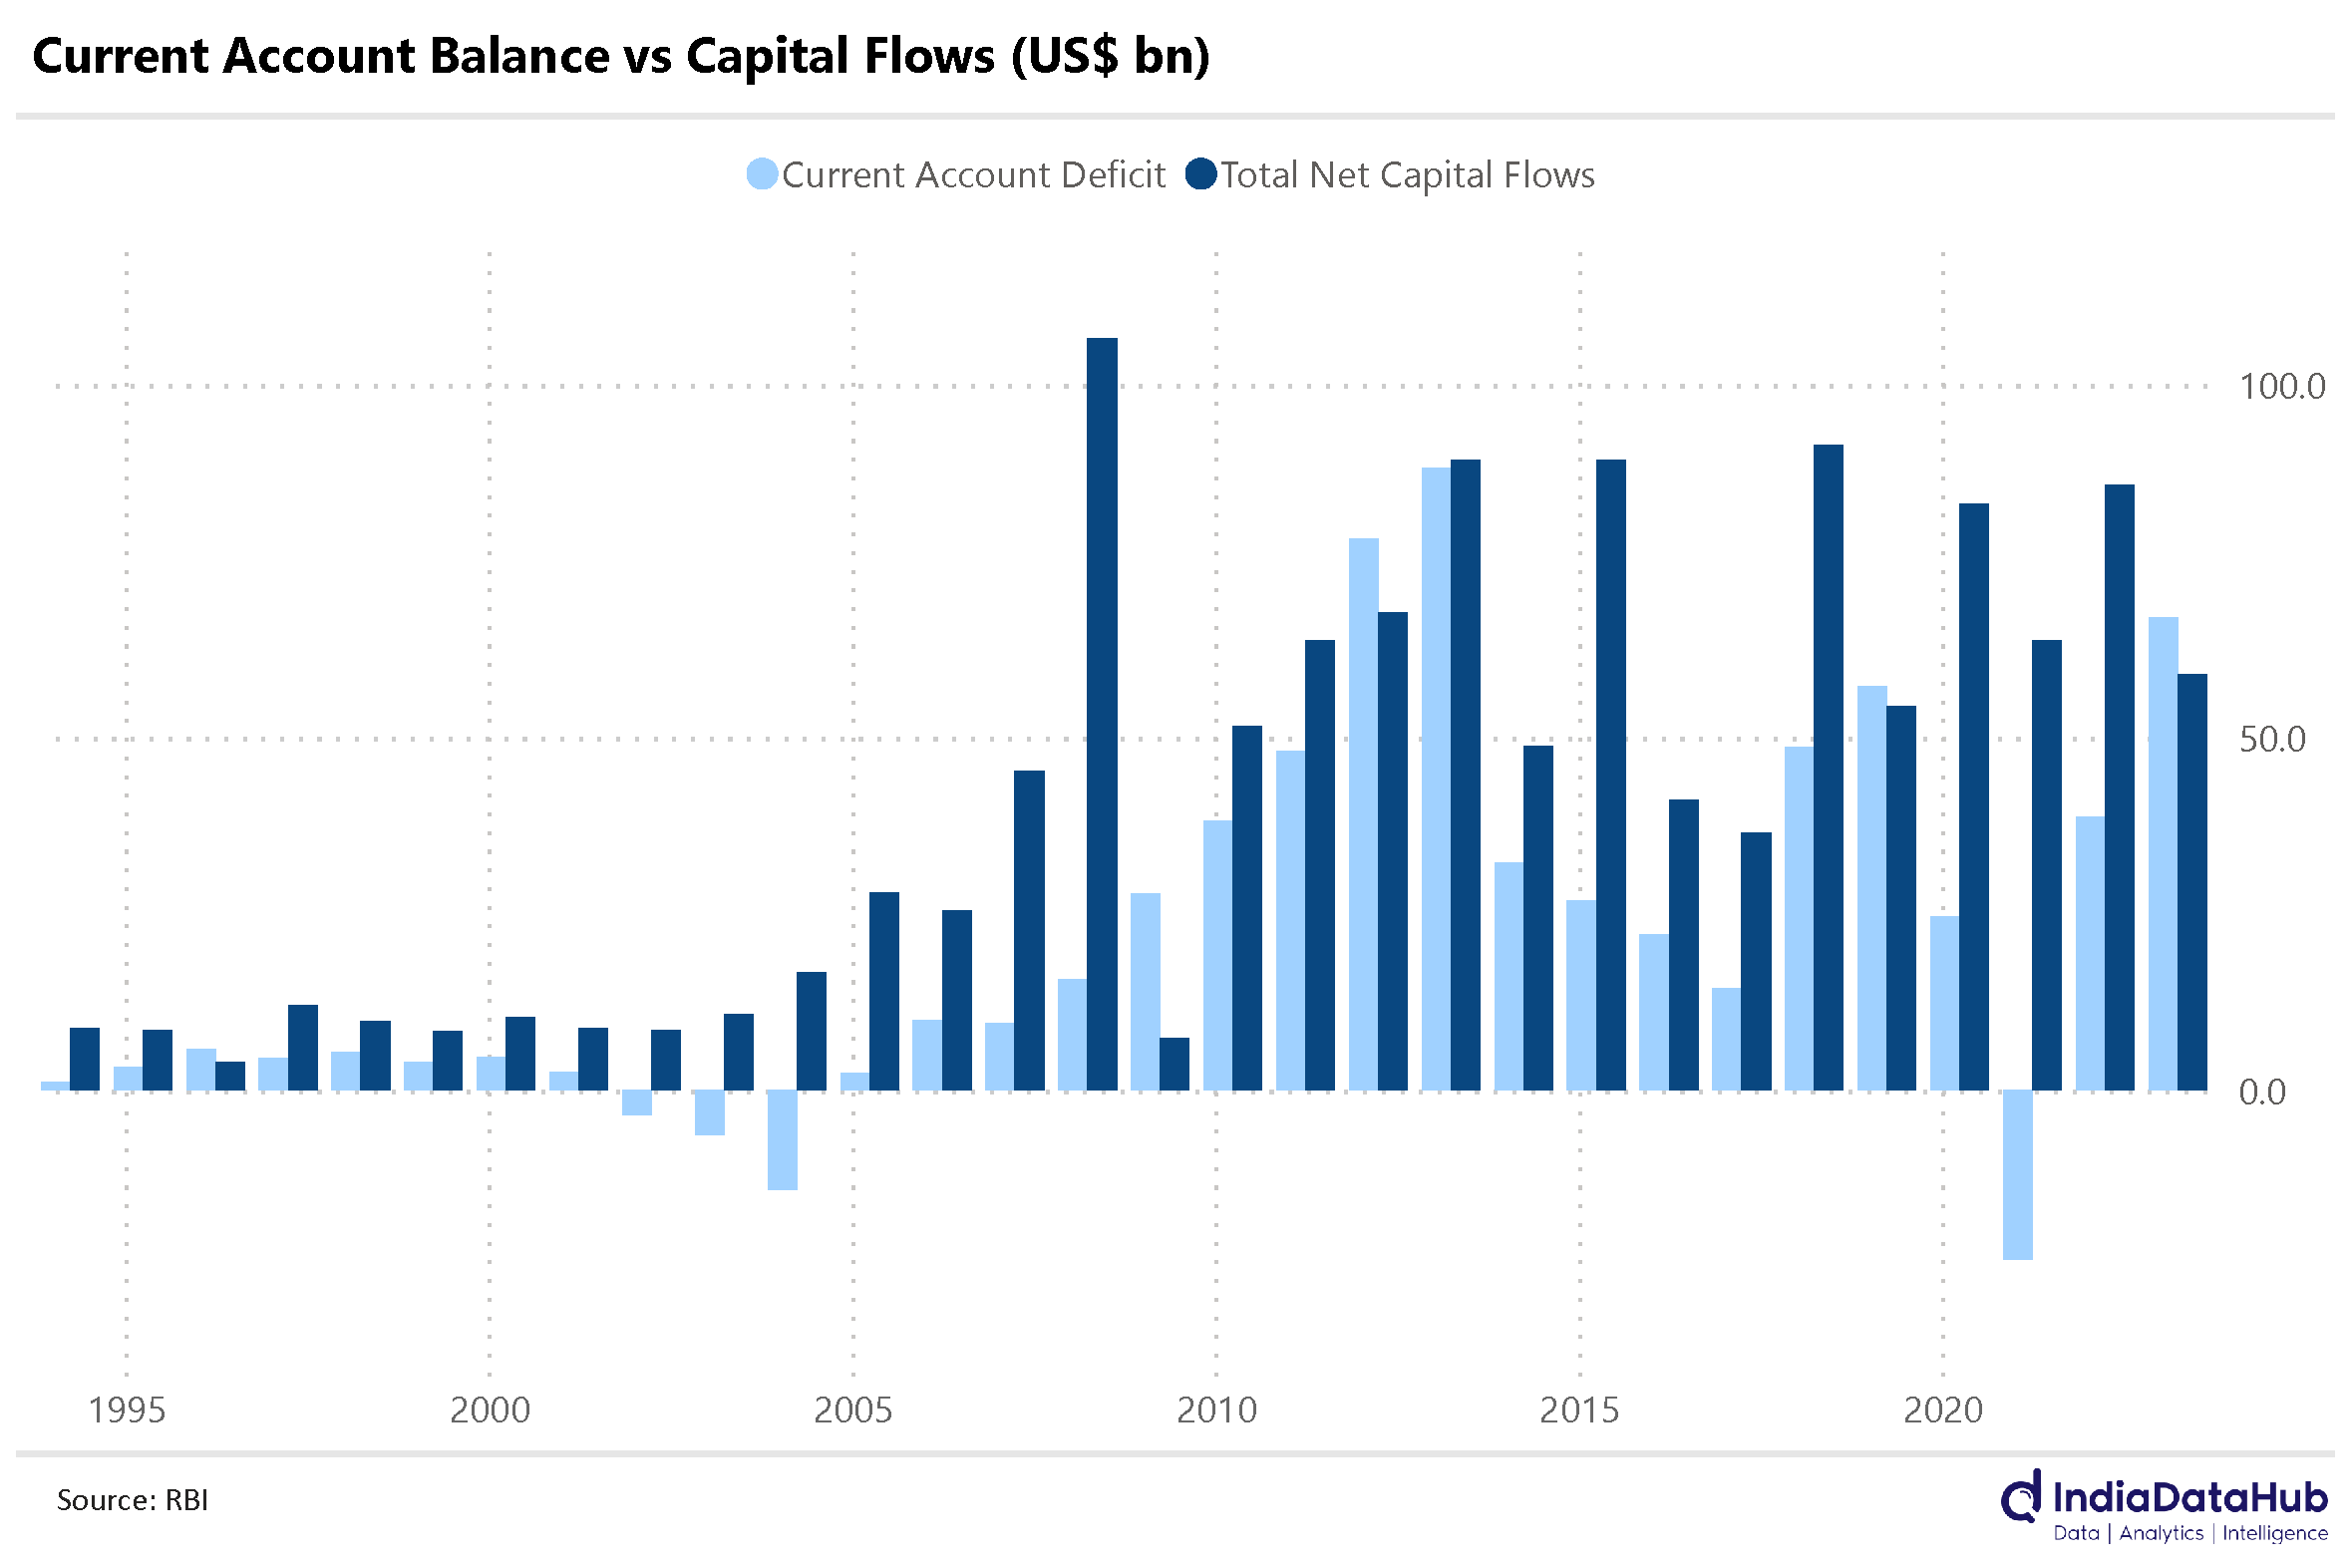
From a policy perspective though the reason the government has been chasing this is because this opens one more source of capital flows. And because we as a country run a structural current account deficit (CAD), we need fairly large capital flows every year. However, in most years India has been comfortably able to meet the CAD through the existing sources of capital flows such as FDI, commercial borrowings and portfolio flows into equities. In the last 3 decades, for example, there have only been 5 years in which the capital flows were not sufficient to meet the CAD.
So, these debt flows are not critical from an external account or balance perspective. Also, if government programs like Make in India succeed (even partially), India’s current account deficit will likely fall and thus the scale of capital flows needed will also reduce in that case. If capital flows far exceed the CAD, the RBI has tools to deal with it and it is something it has dealt with several times in the past.
So other than this being yet another validation of India as an attractive investment destination, this inclusion in bond indices, isn’t likely to dramatically change things a lot in the short-term. Not the most popular opinion, but it is what it is. There are some longer-term implications that we will discuss in our musings in the coming week.
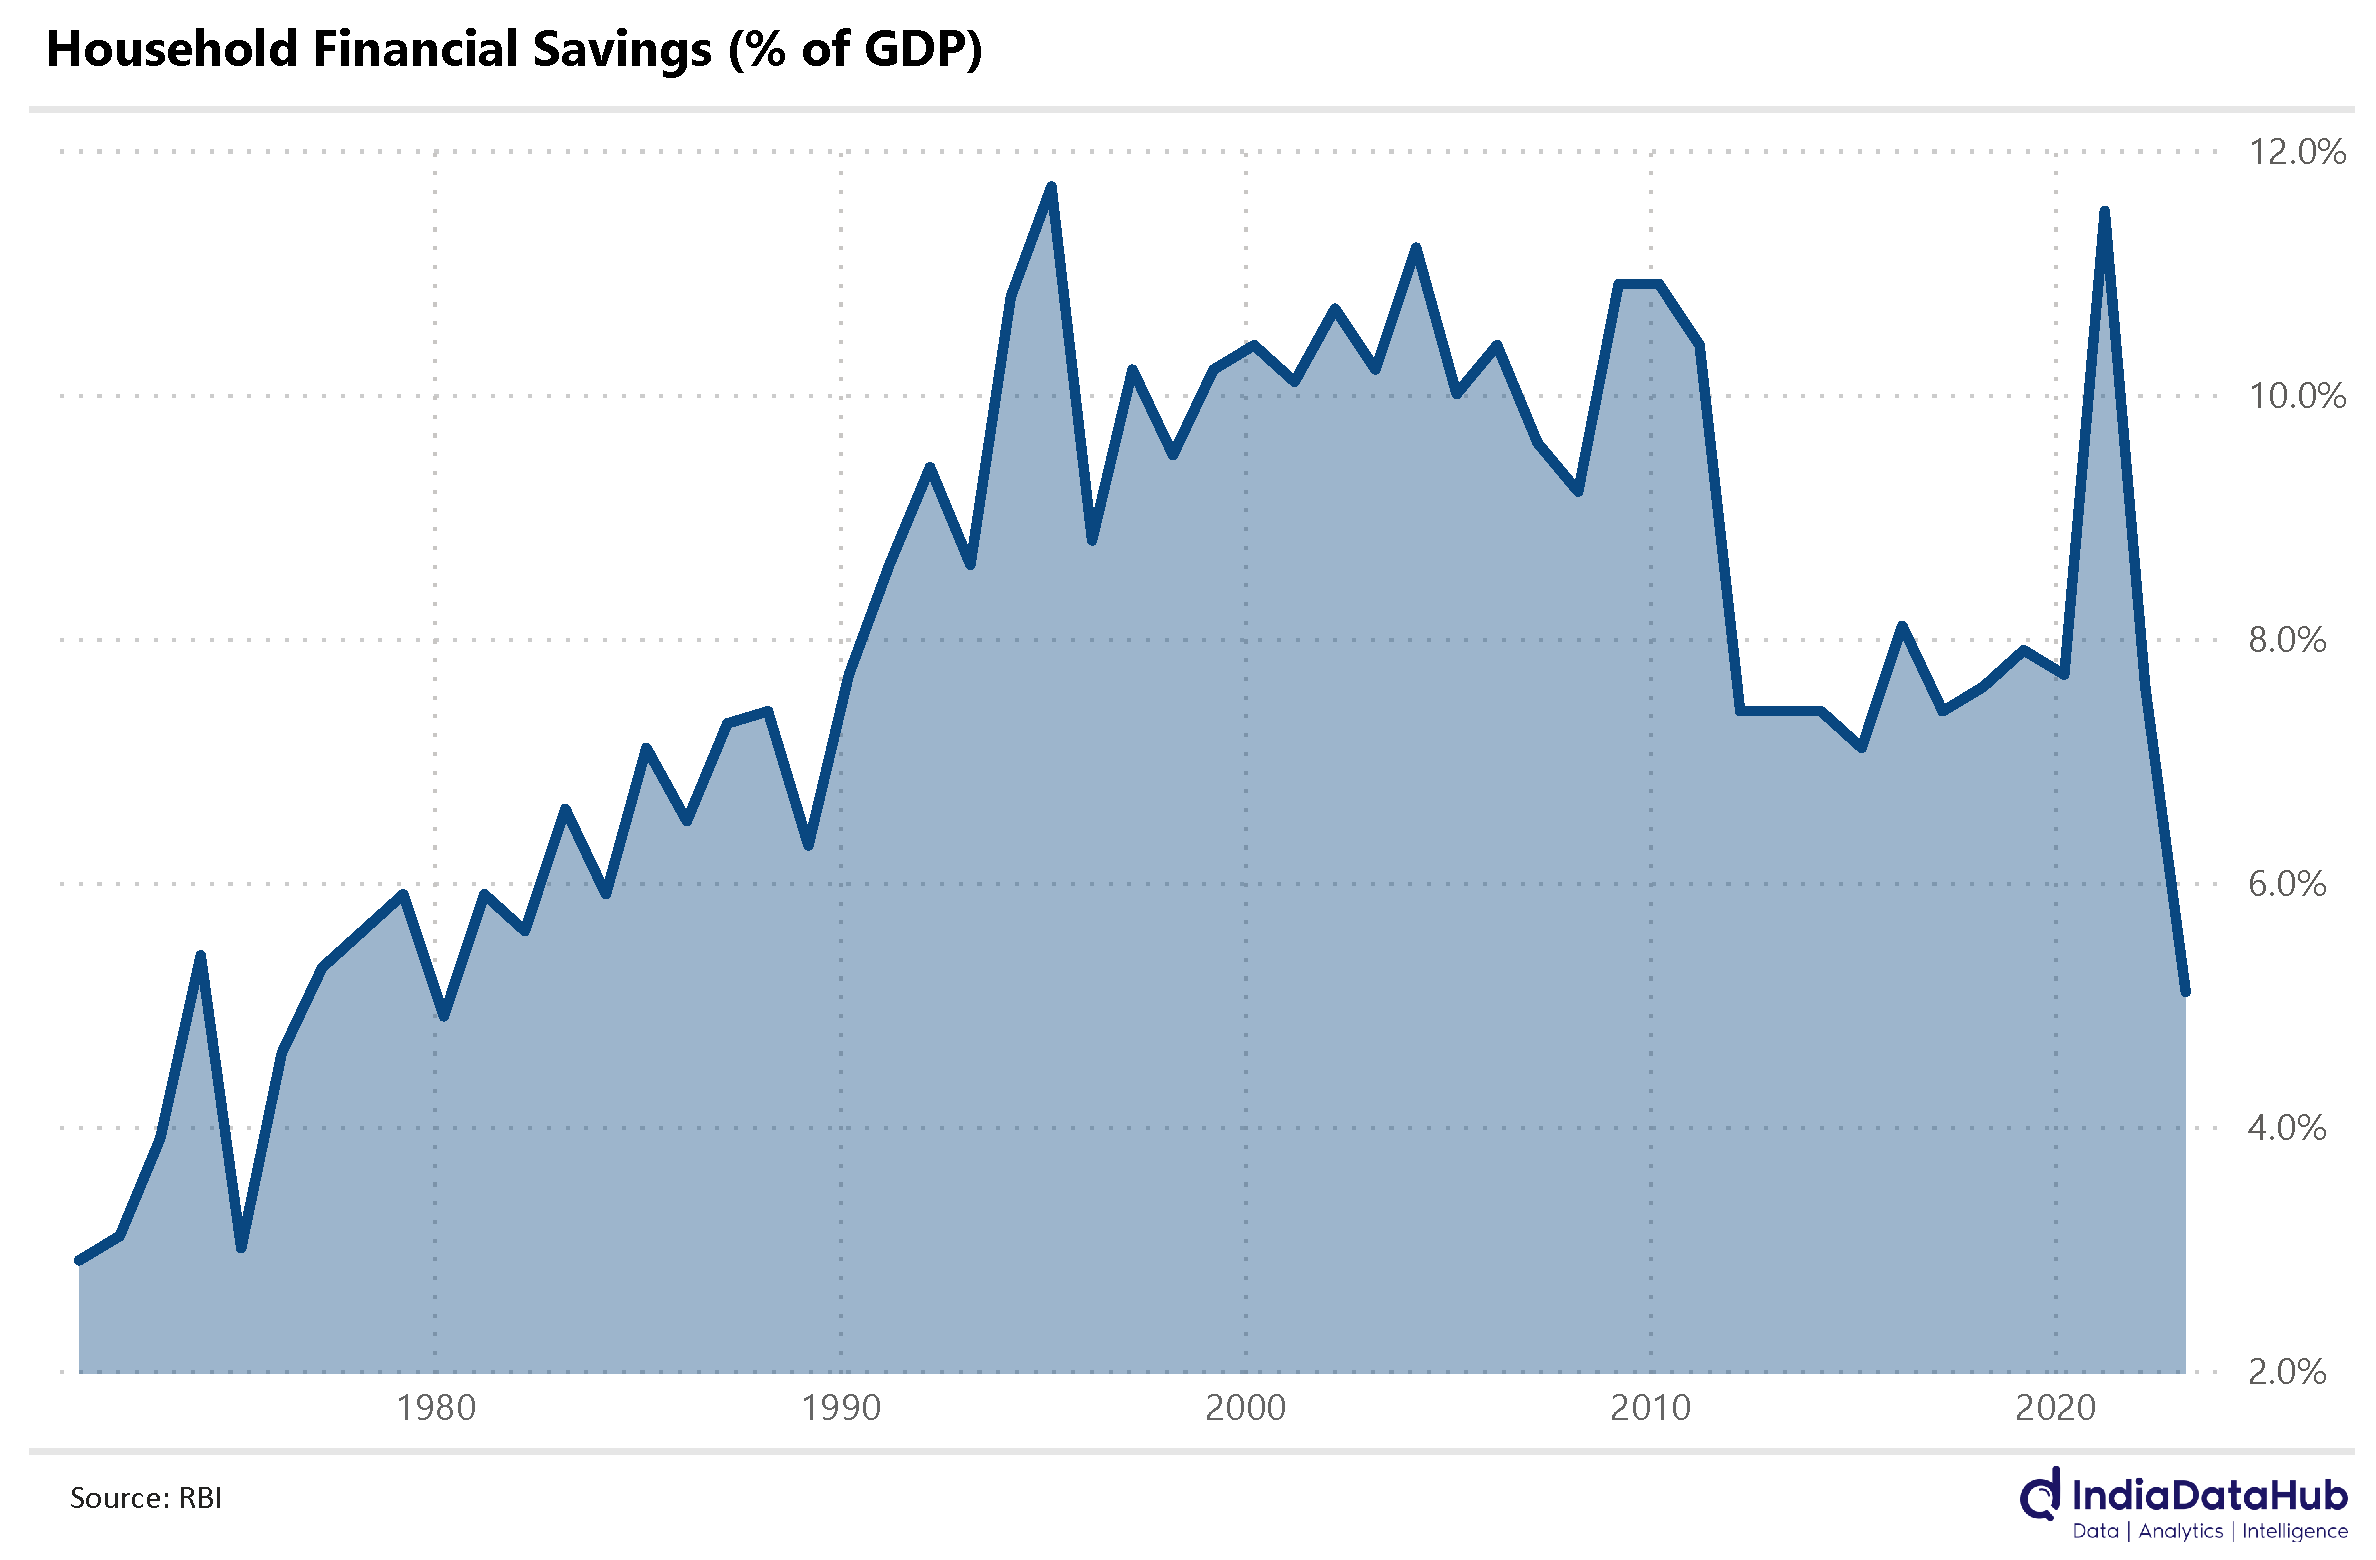
The second big story for the week was the financial savings data. As per the provisional data from RBI released this week, the financial savings of households declined to a multi-decade low (43-year low to be precise) of 5.1% of GDP in FY23. Now financial savings is only one part of the picture, the other being physical savings for which we will get data only early next year. So, we do not know for sure whether the lower financial savings have been offset by higher physical savings or whether they reflect lower household savings in aggregate.
What we know however is that the overall economy-wide savings rate declined in FY23 to ~29% of GDP from 30% of GDP in FY22. This is because India’s CAD expanded in FY23 even though the investment rate declined modestly (and the gap between investments and savings equals the CAD).
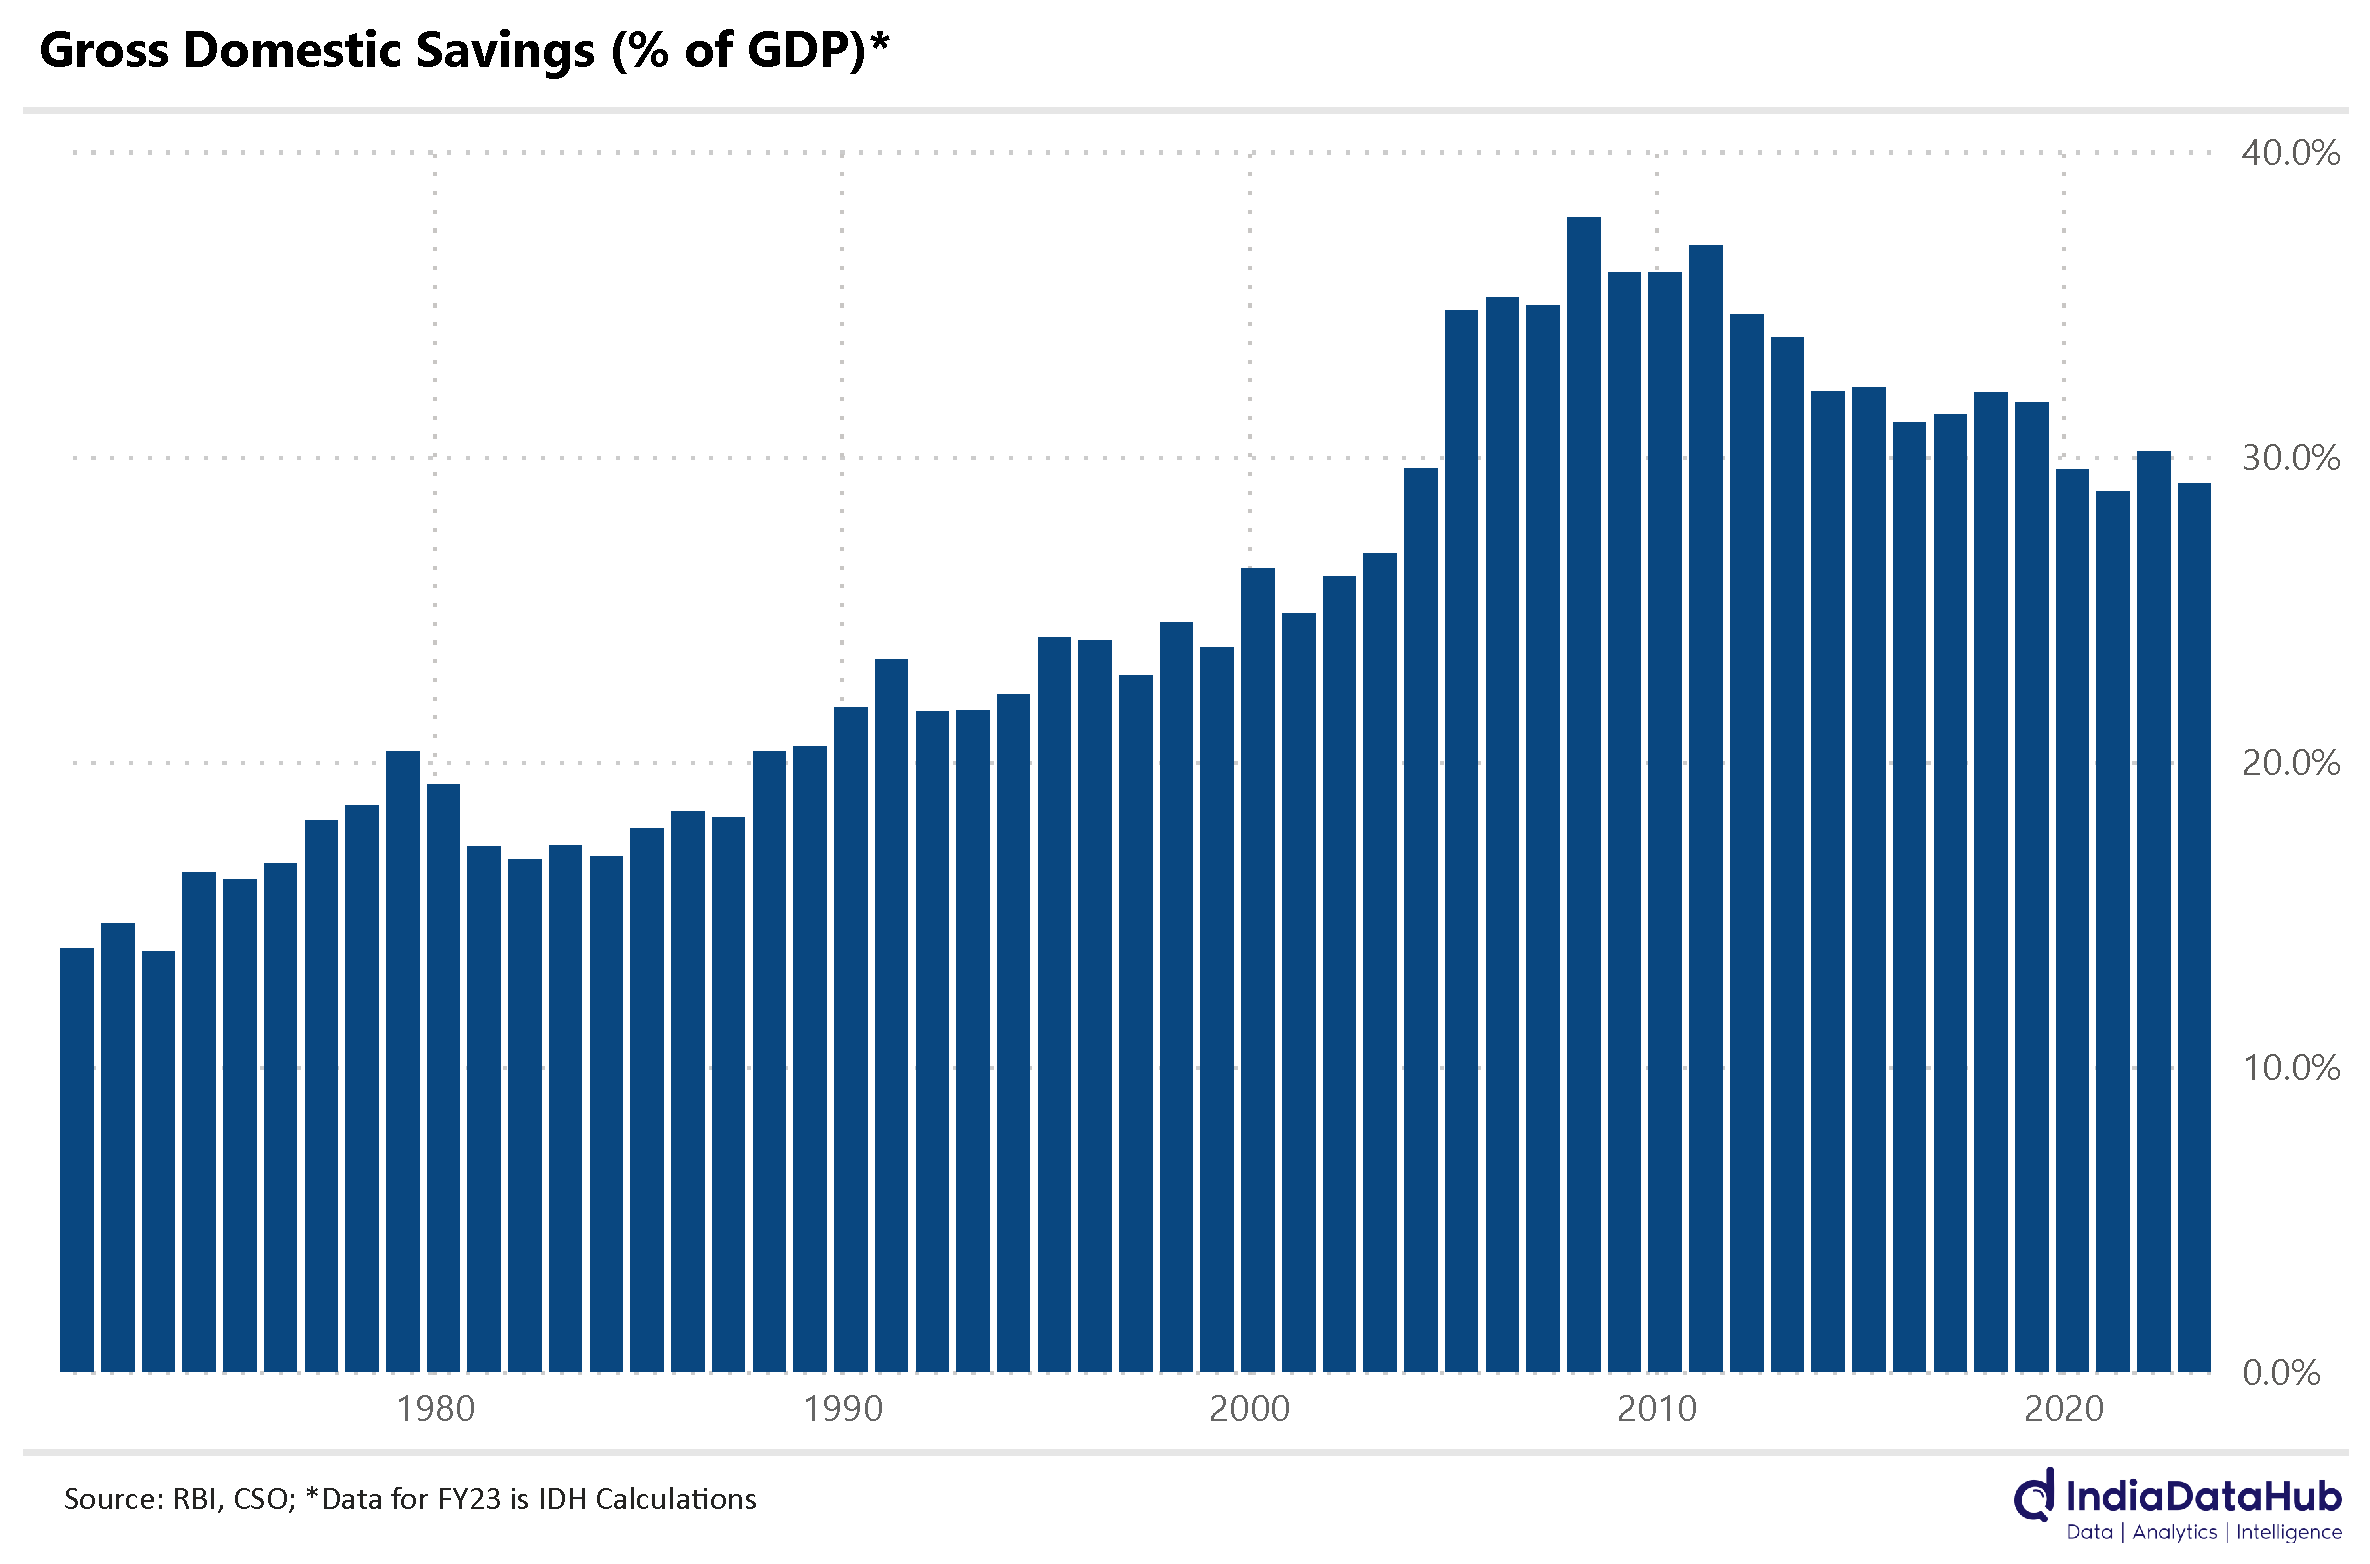
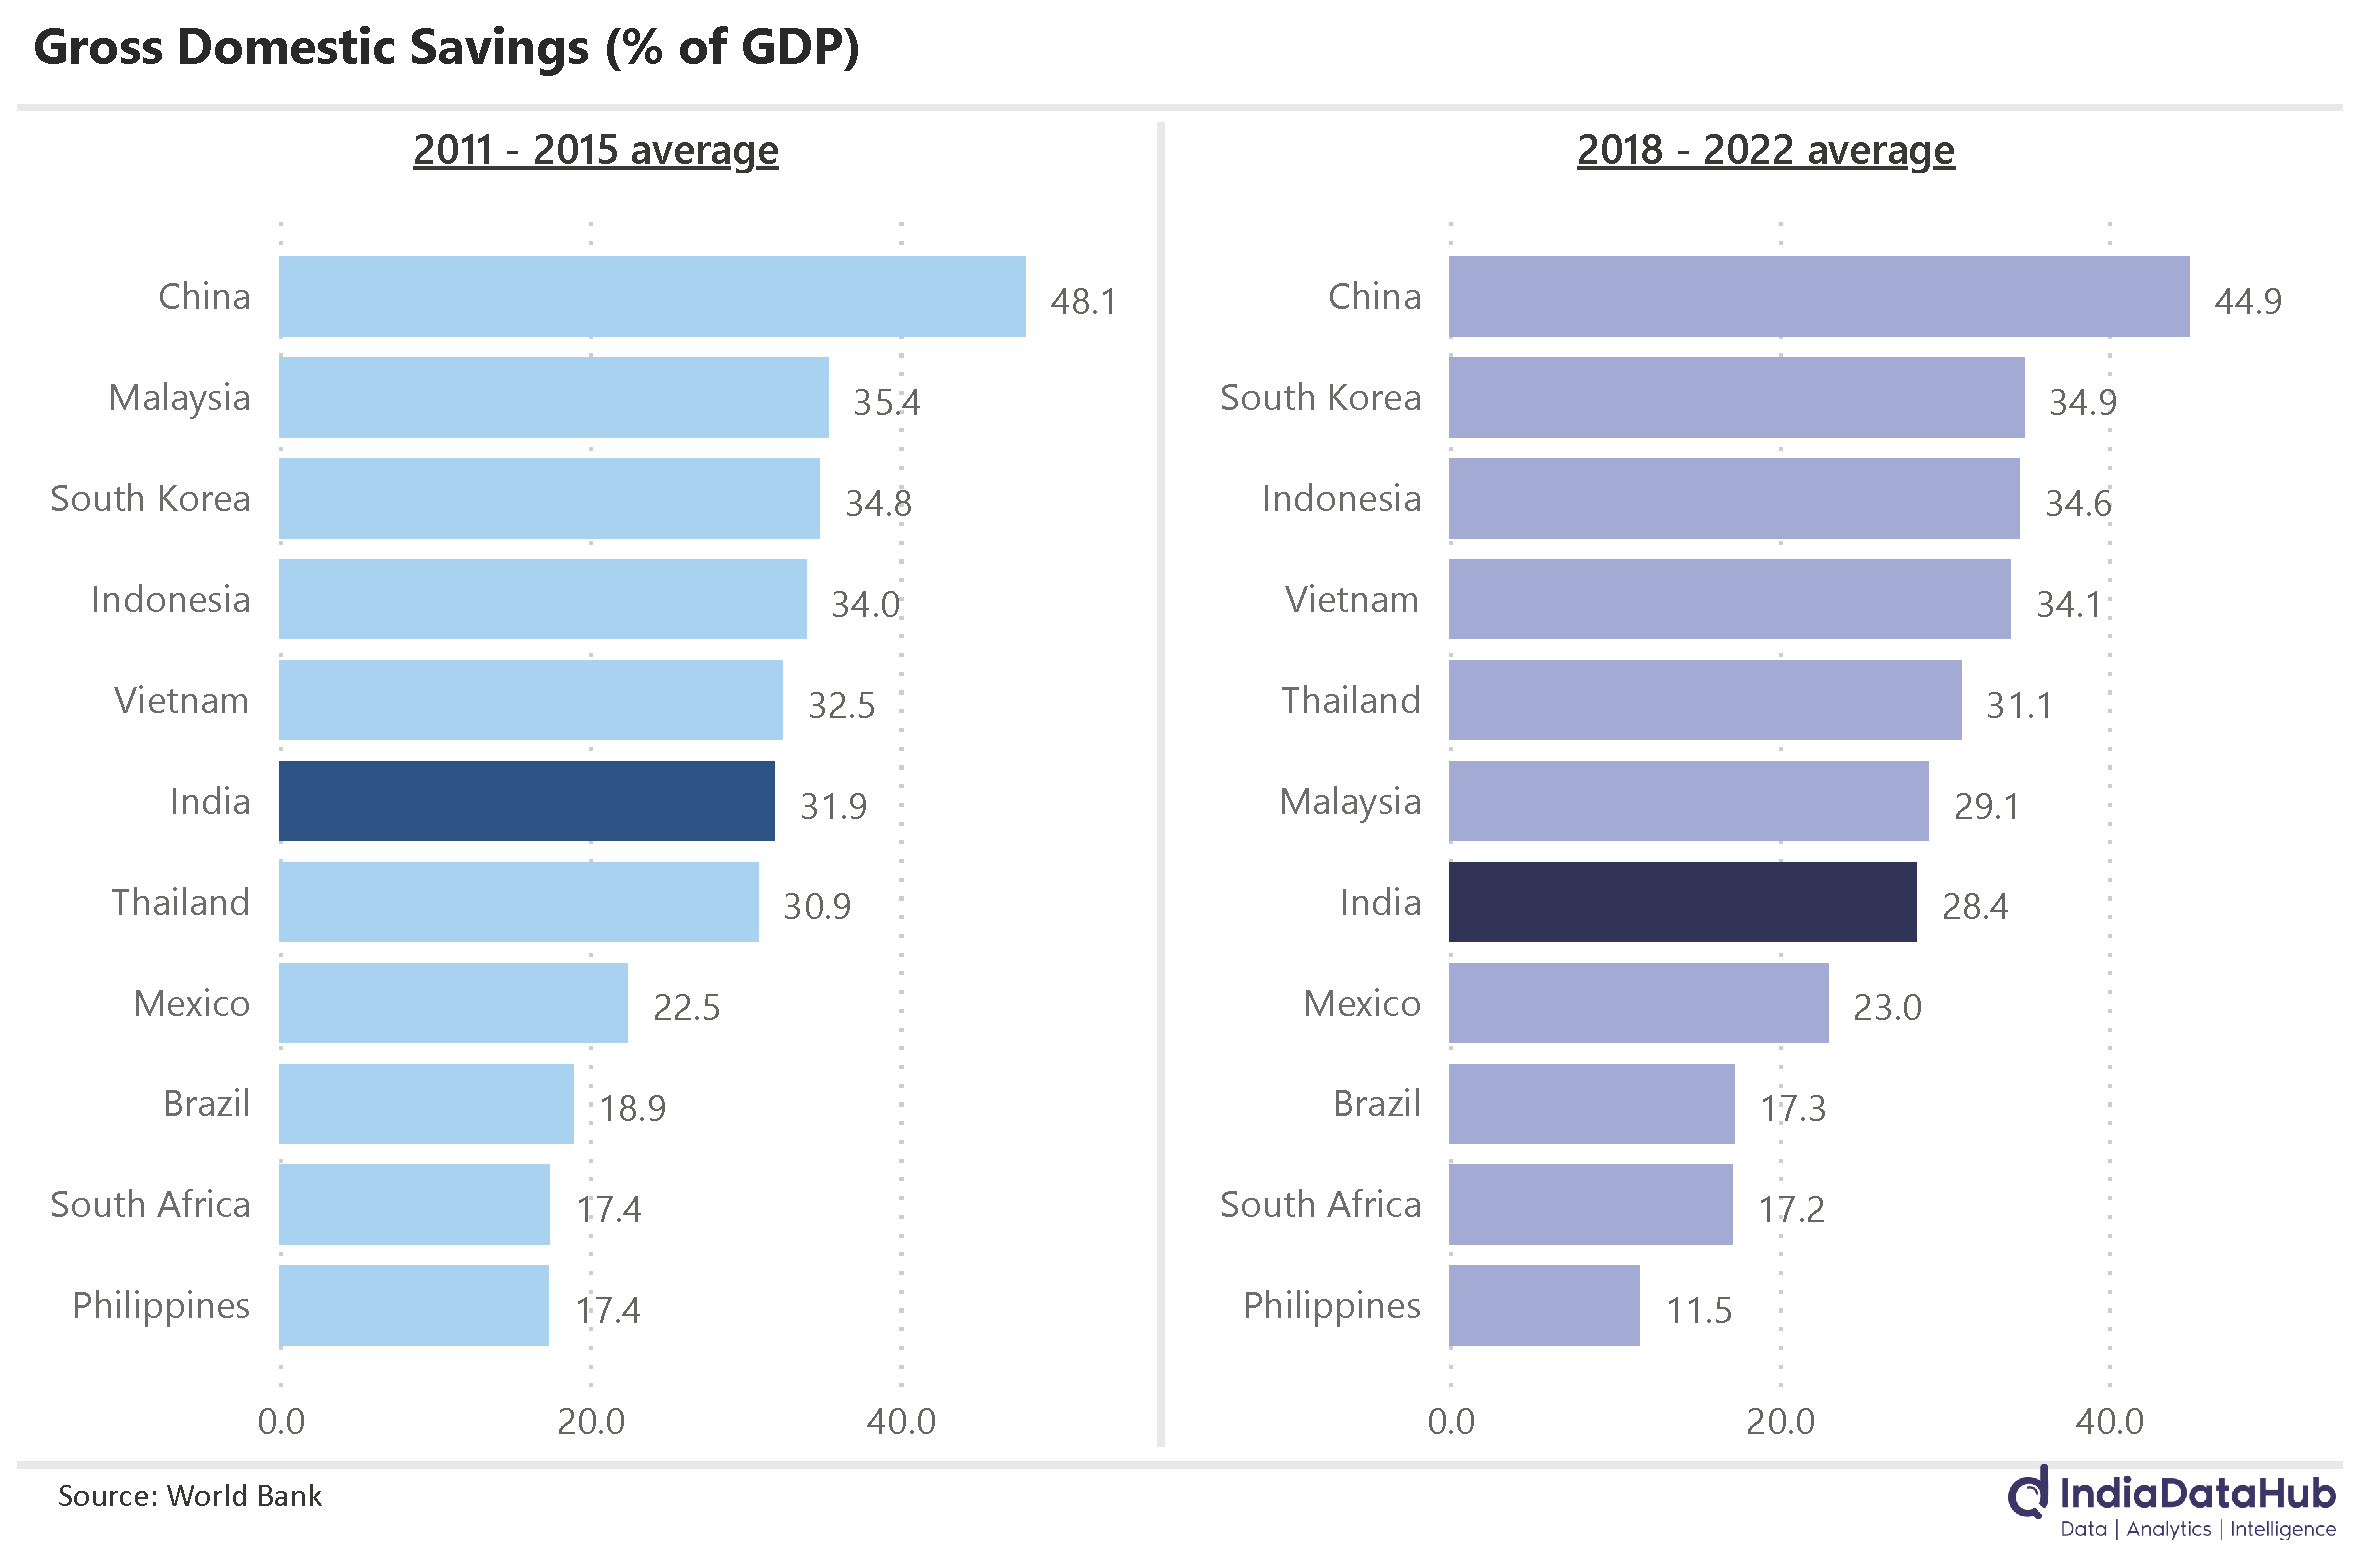
The big picture though is that India's savings rate has been on a downtrend in recent years. At 29% of GDP in FY23 India’s savings rate will be the lowest in almost 2 decades. Relative to most other Asian emerging market economies, India’s savings rate is now almost 4-5ppt lower. So, from an EM context, India has gone from a relatively high savings economy to a moderate savings economy. Among the Asian countries, only the Philippines has a lower savings rate than India. Our savings rate is still much higher than say the Latin American countries like Brazil or Mexico where the savings rate is below 25%.
As we discussed above, the only way to increase investments is either through increasing savings or by running a higher current account deficit. And while in the short-run a high current account deficit can be funded through higher capital flows, it does leave one vulnerable to swings in capital flows. And we only need to go back to 2013 to remind ourselves of what can happen. So, as an economy, there is a need to augment savings. And it is largely irrelevant whether it is of the financial kind or the physical kind.
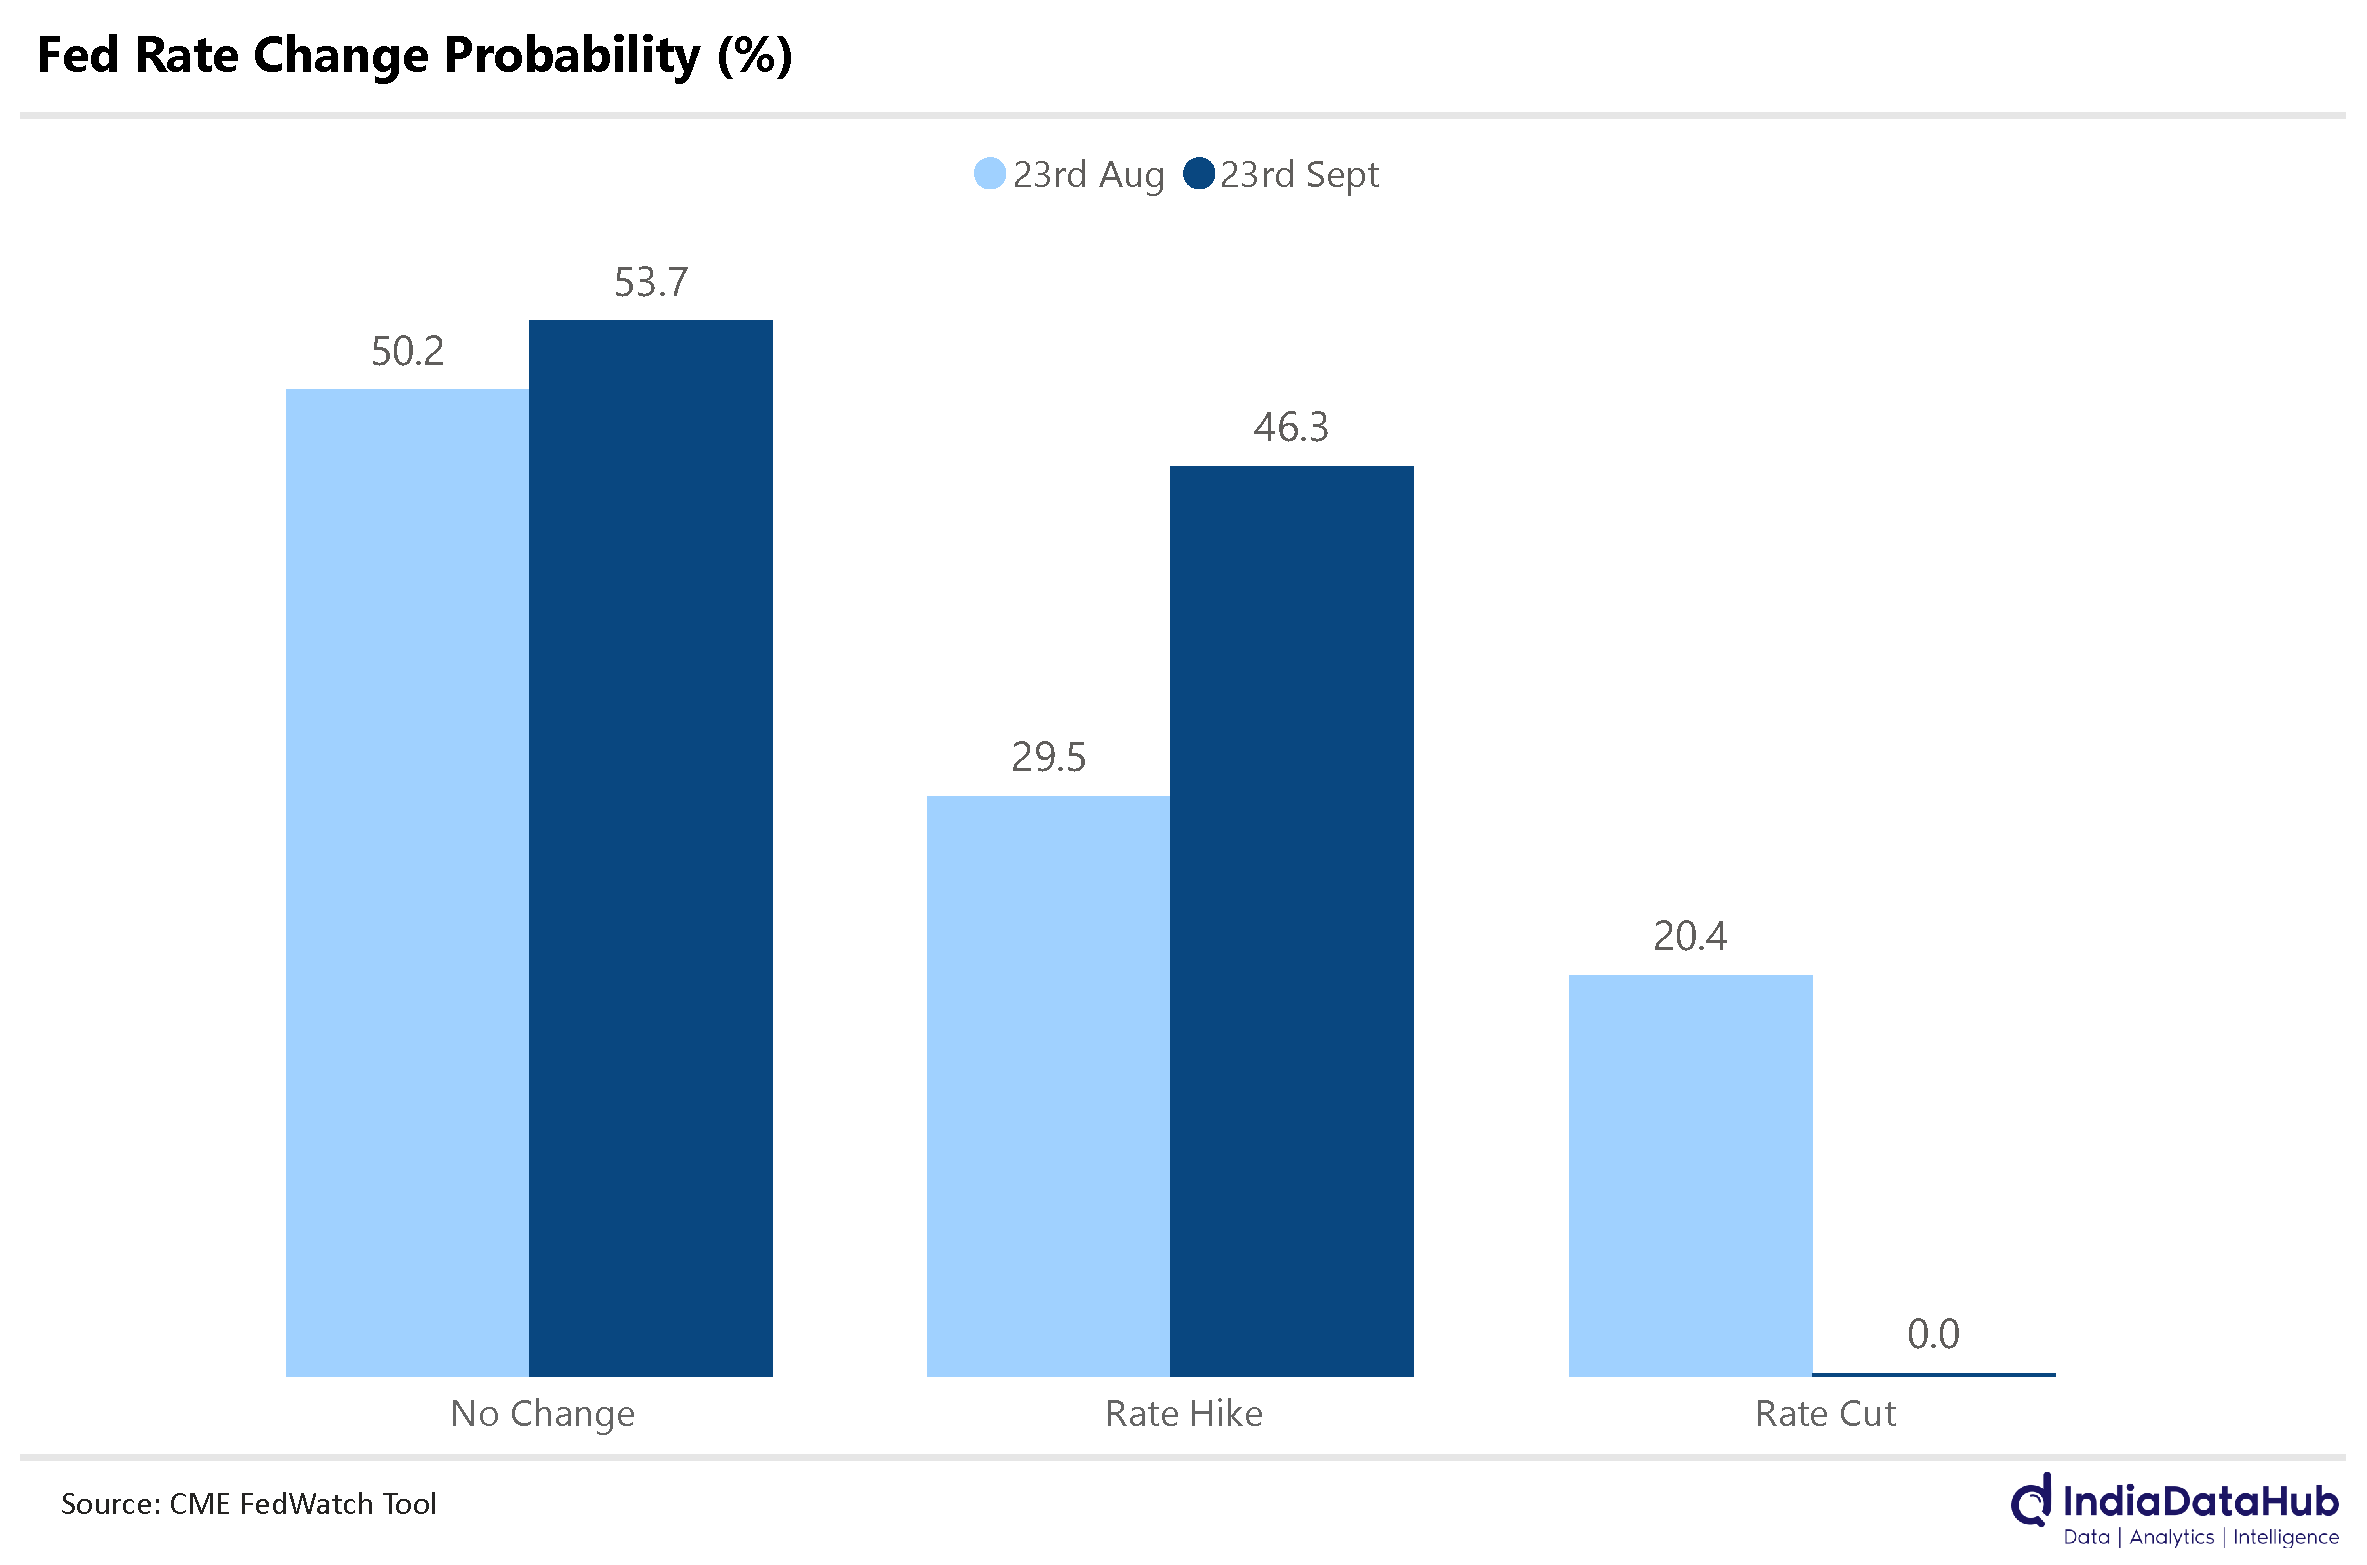
Lastly, the Fed. It kept interest rates unchanged in its policy meeting this week. But it did leave the door open for a one-last rate hike later this year or early next year. Accordingly, the Fed Fund futures are now implying a 46% probability of a rate hike from the Fed between now and the end of January whereas a month back, the odds of a rate hike were less than 30%. More importantly, the probability of a rate cut from the Fed crosses 50% only by July next year. So, US rates and in turn global rates, are likely to remain higher for longer.
And this feeds back to the first topic discussed today. The US 10-year yield is currently at 4.5% and the India 10-year yield is at 7.2%. The differential is less than 3ppt. Perhaps a fair bit of the reason why a large part of the bond investment limits is unutilised, is that the rate differential is not adequate given India’s credit rating. If so, if and when the rate differentials widen, flows into debt market will again pick up.
That’s it for this week. Have a good weekend!