
Falling commodity prices, Rupee rises, Strong Services Exports and more...
This Week In Data #123
In this edition of This Week In Data, we discuss:
Global commodity prices fell sharply in April
Energy and metal prices fell to multi-year lows
Rupee has reclaimed most of its recent fall
Services exports could overtake goods exports in FY26
US labour market continues to remain strong
US GDP growth declines with consumption a key drag
April saw a sharp increase in volatility in global financial markets due to the uncertainty over the US tariffs and their impact on the global economy. The IMF has sharply lowered its global growth forecasts for this year. While these are negative developments, the flipside of this is that global commodity prices fell sharply in April. The World Bank’s Commodity Price Index fell almost 6% MoM, the sharpest decline since mid-2023. This was driven largely by Energy and the Base metals, both of which declined by almost 8% MoM.
Brent crude oil for example averaged US$68/bbl in April, the lowest price in the last 4 years. On a YoY basis, the price has fallen over 20% YoY. International coal prices (Newcastle) have similarly fallen to a 4-year low of US$99/MT in April. Post the decline, Aluminium prices in April were 5% lower on a YoY basis while Iron Ore prices were 14% lower and Lead prices were 11% lower.
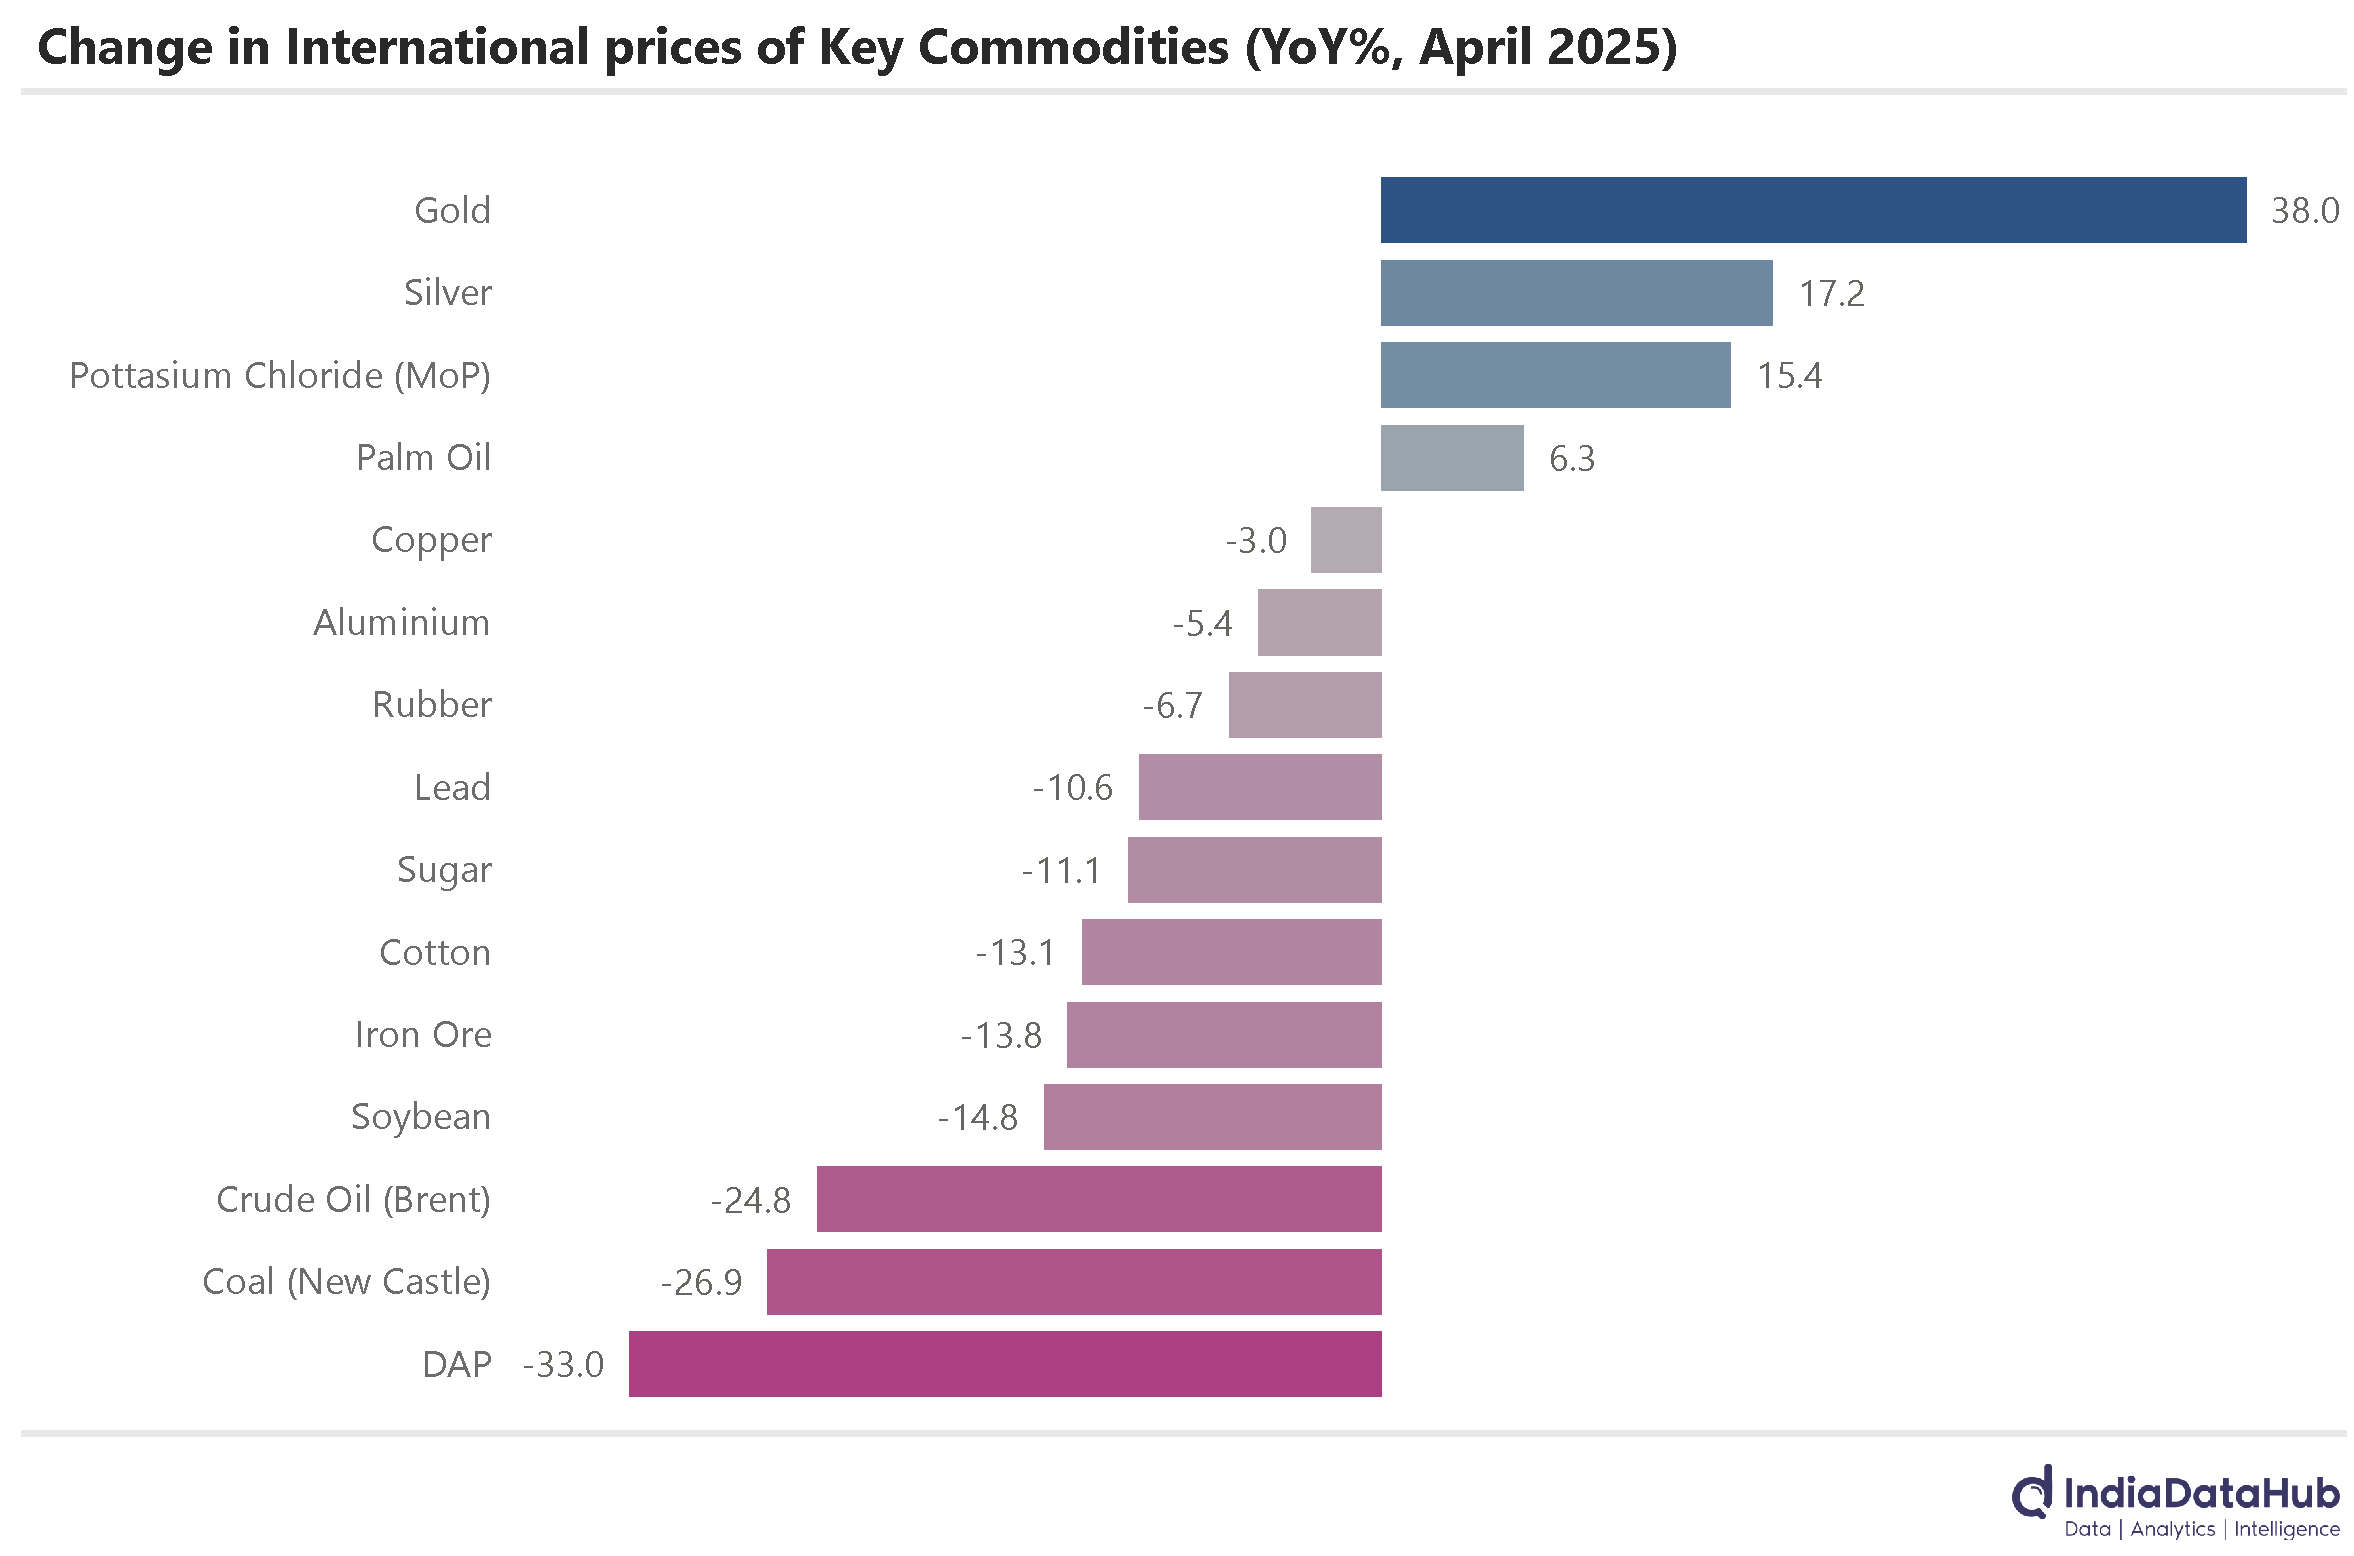
Even some soft commodity prices are sharply lower on a YoY basis – Cotton prices in April for example were 13% lower on a YoY basis, Sugar prices were 11% lower and Rubber prices were 7% lower.
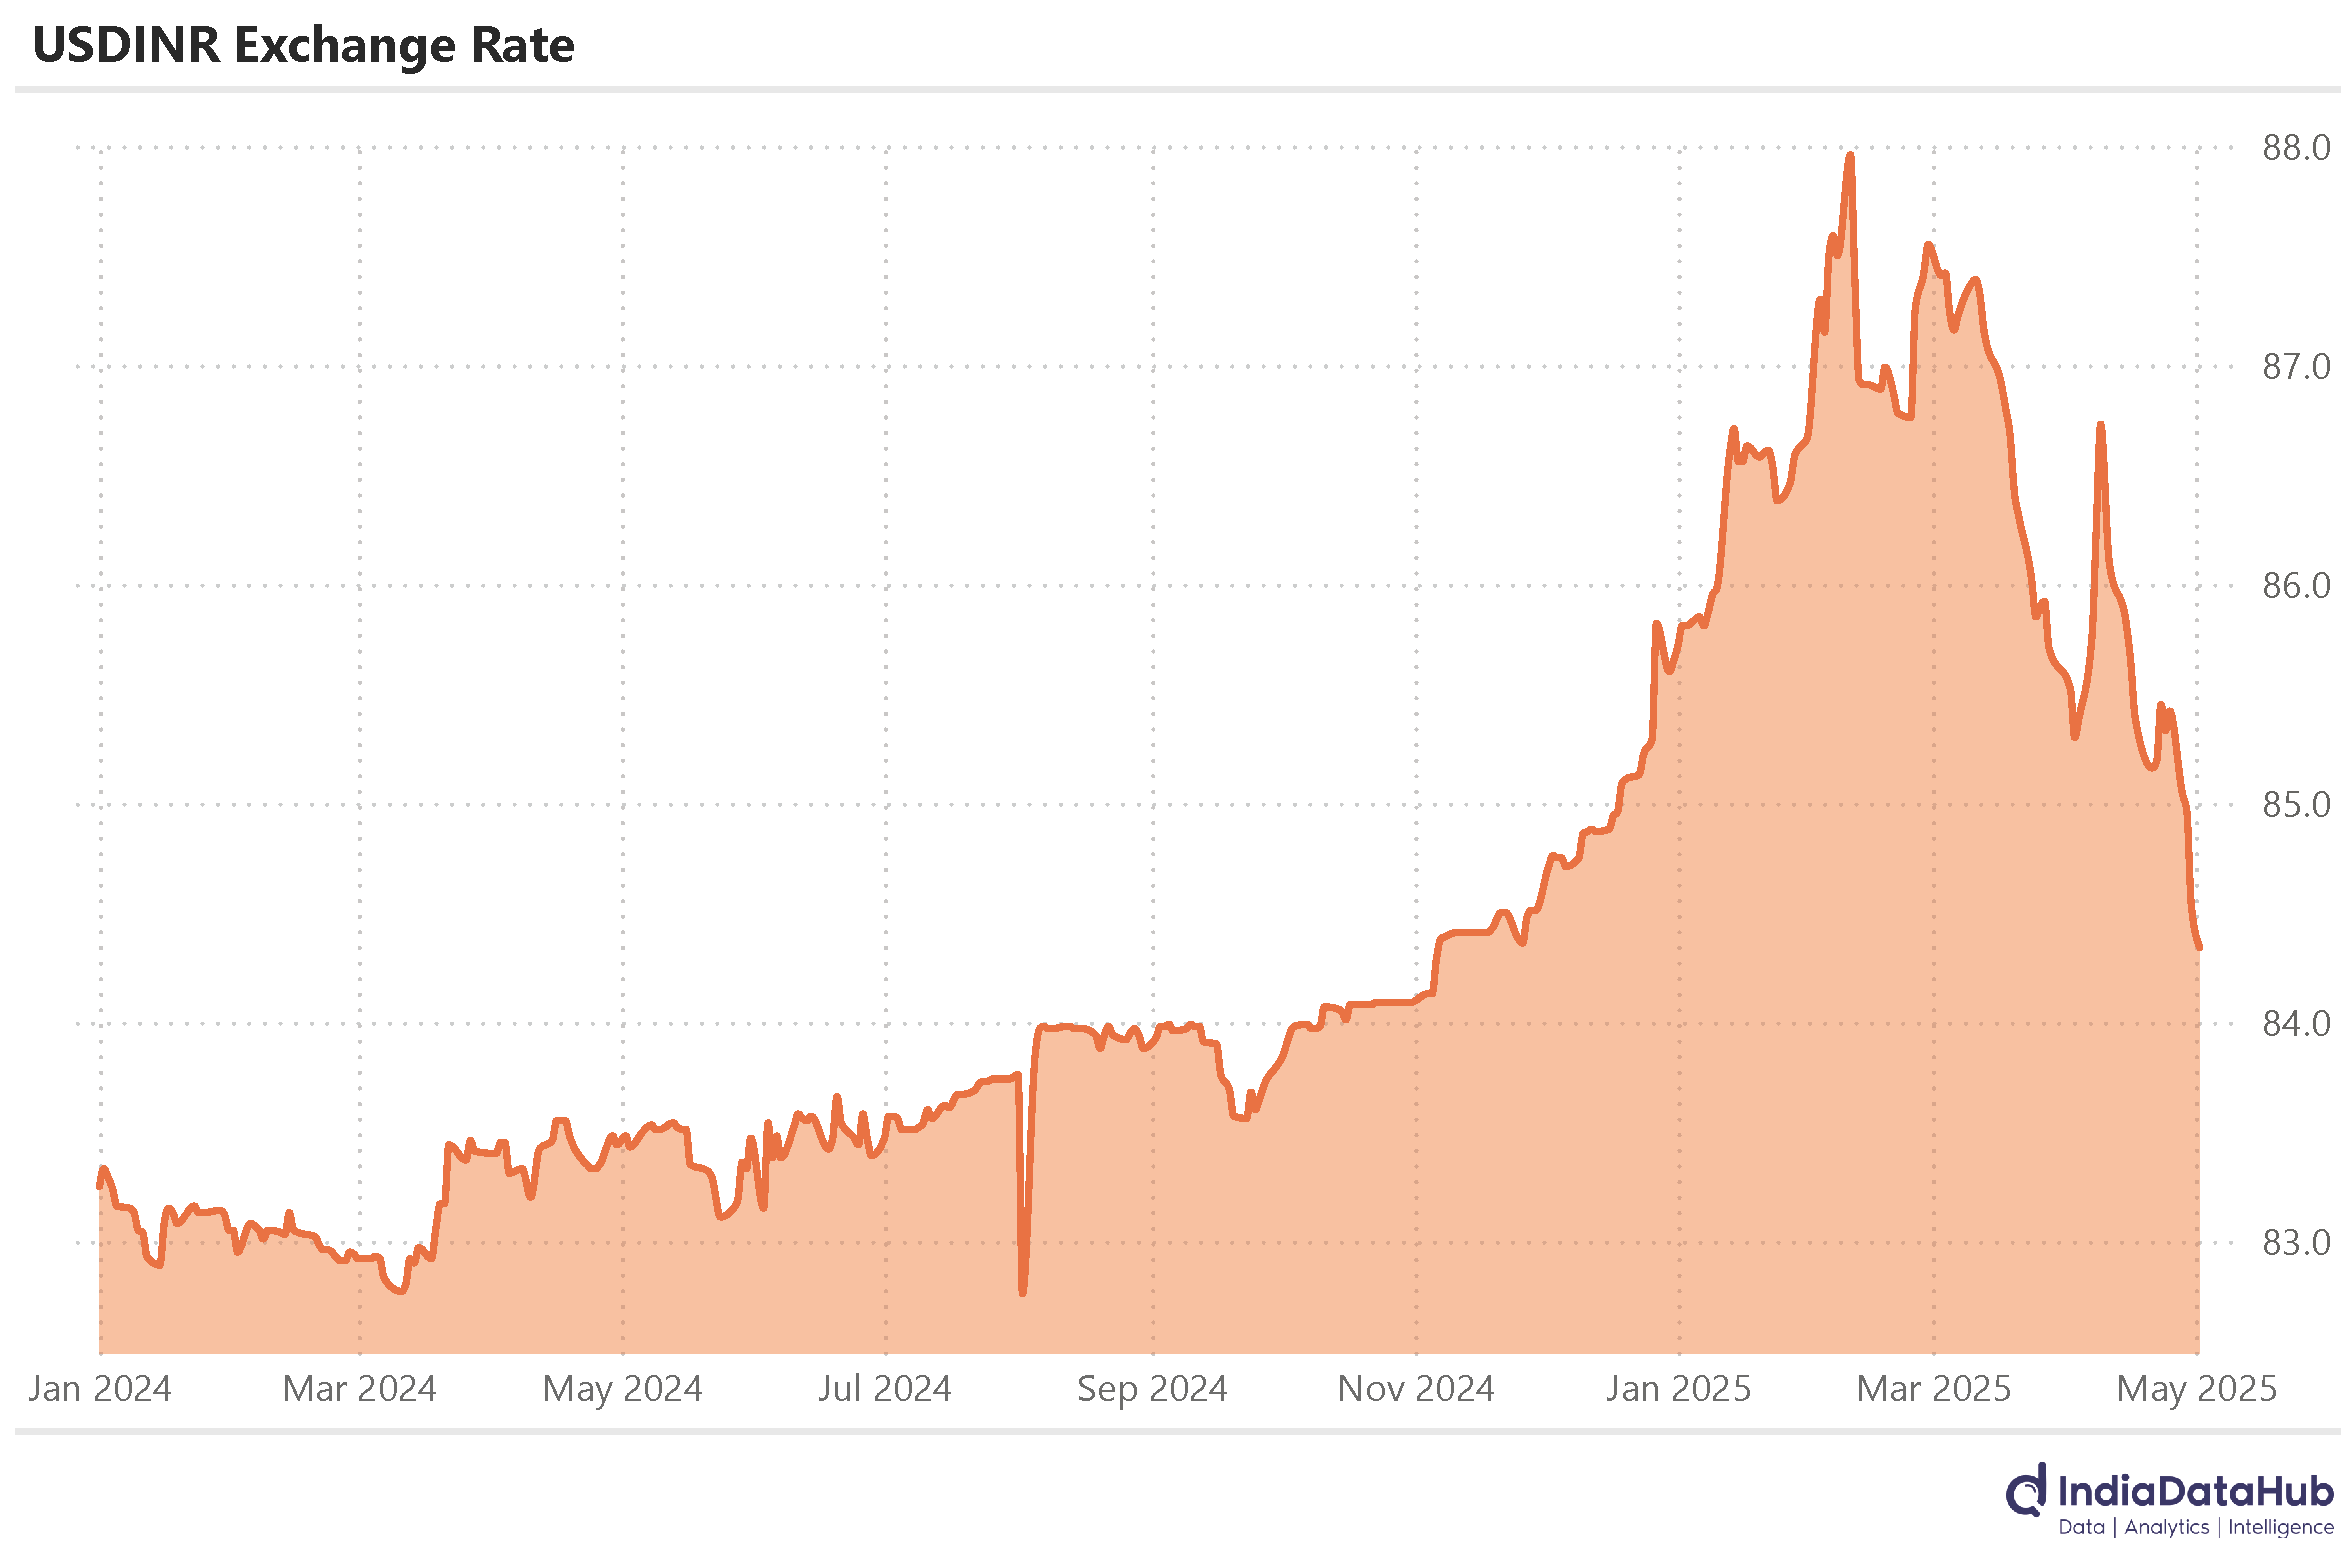
The rupee has appreciated sharply in the last few days. The rupee closed below 84.4 against the USD yesterday after having reached a low of 87.5 a few weeks back. On a YoY basis, the rupee is thus down less than 1.5% over the past year. It has reclaimed back most of its recent fall. Thus, most of this recent decline in commodity prices (if sustained) will transmit to the domestic economy in terms of lower import prices. And this will have a salutary impact on inflation and also on the profitability of commodity-consuming businesses.

Services exports rose 18% YoY in March as per the provisional data, the fastest growth since October last year. Imports however rose a modest 5% YoY and consequently, the services trade surplus rose over 30% YoY for the second consecutive month.

For the full year FY25, services exports rose 13.5% YoY. In contrast goods exports were unchanged for the year. Services exports now total to almost 90% of merchandise exports. Just 5 years back, services exports were less than 70% of goods exports. If the growth rate of FY25 were to repeat in FY26, services exports will overtake goods exports. India will become of the few countries (and possibly the only large economy) where services exports exceed the goods exports!
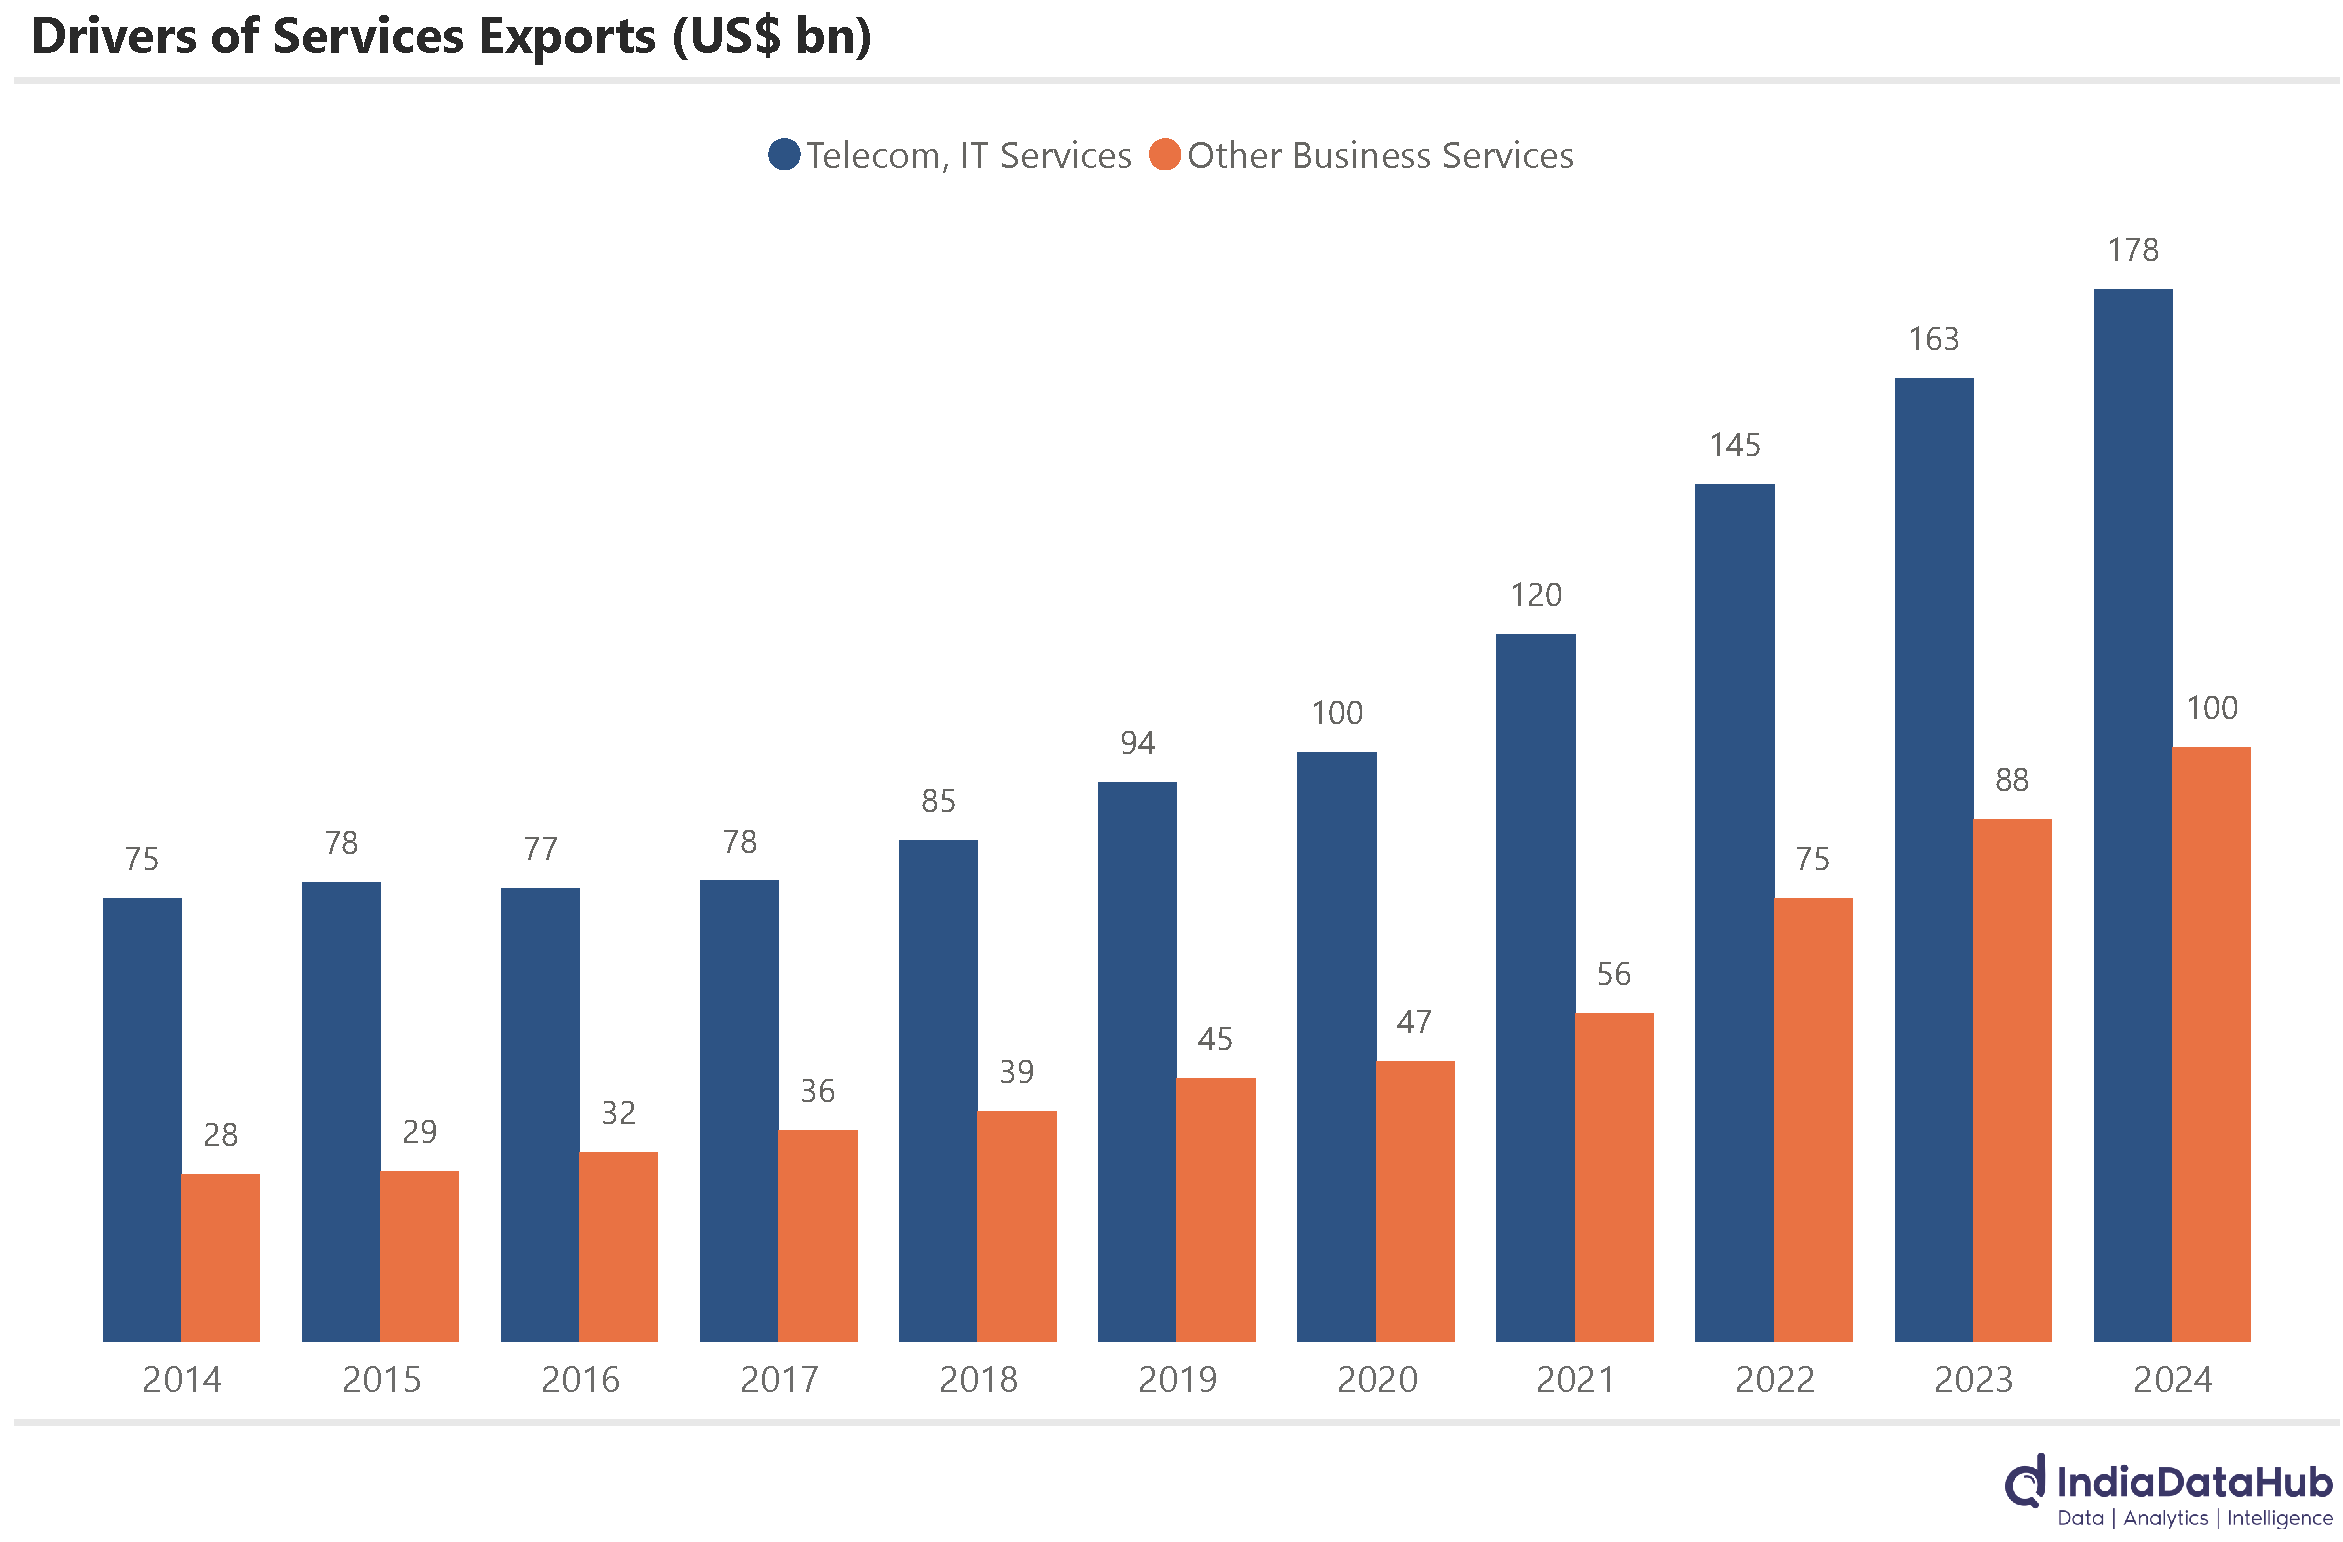
And while historically it was the IT services which was the key driver of services exports, it is now the whole gamut of business services which includes engineering, R&D, accounting, legal and other services which is the key driver. Over the past decade for instance, while the traditional Telecom and Computer services exports have grown by 9% Cagr, the other business services have grown by almost 14% Cagr. Exports of other business services totalled US$100bn in calendar year 2024, up 3.5x over the past decade. Effectively, India’s services export engine is getting broad based. And the whole momentum behind GCCs is a manifestation of this.

Globally the data was mixed. The US payroll data continues to remain strong. The US economy added 177k jobs in April as per the preliminary data, only a slight decrease from the 185k jobs added in March. This was however higher than the addition in either January or February. Employment continued to rise in sectors like healthcare, transportation, and warehousing, while federal government employment saw a decline. The unemployment rate remained largely unchanged at 4.2% in April.
But the US GDP growth declined by 0.3% QoQ SAAR during the March quarter as per the advance estimate. This is the first decline in the past 3 years. This decrease though was primarily driven by a sharp rise in imports (in anticipation of the tariffs kicking in) and a reduction in government spending. Net imports grew over 100% QoQ SAAR as Imports rose at an annual rate of over 40% during quarter. Net imports were the biggest drag on the economy since the June quarter of 2020, at the start of the Covid19 pandemic. However this was at least partially offset by higher investments (mostly inventories, a direct consequence of higher imports). So on a net basis, higher imports were not a key drag on growth. The key drags were lower government spending and weaker consumption.

Government consumption declined by 1.5% QoQ SAAR, the first decline in almost 3 years. But it was the household consumption, which contributes almost 70% of the GDP, that was the key drag on growth. It grew by just 1.8% annualised during the quarter, the slowest growth since mid-2023. So while prima facie, the decline in GDP reflects the distortion due to the surge in imports, weak consumption and lower government spending were the more fundamental drag on growth.
That’s it for this week. We will do a rundown of the high frequency data for April next week. Stay tuned…