
Falling CPI, Sluggish exports, China's rising trade surplus and more...
This Week In Data #132
In this edition of This Week In Data, we discuss:
Merchandise exports remain sluggish while imports decline
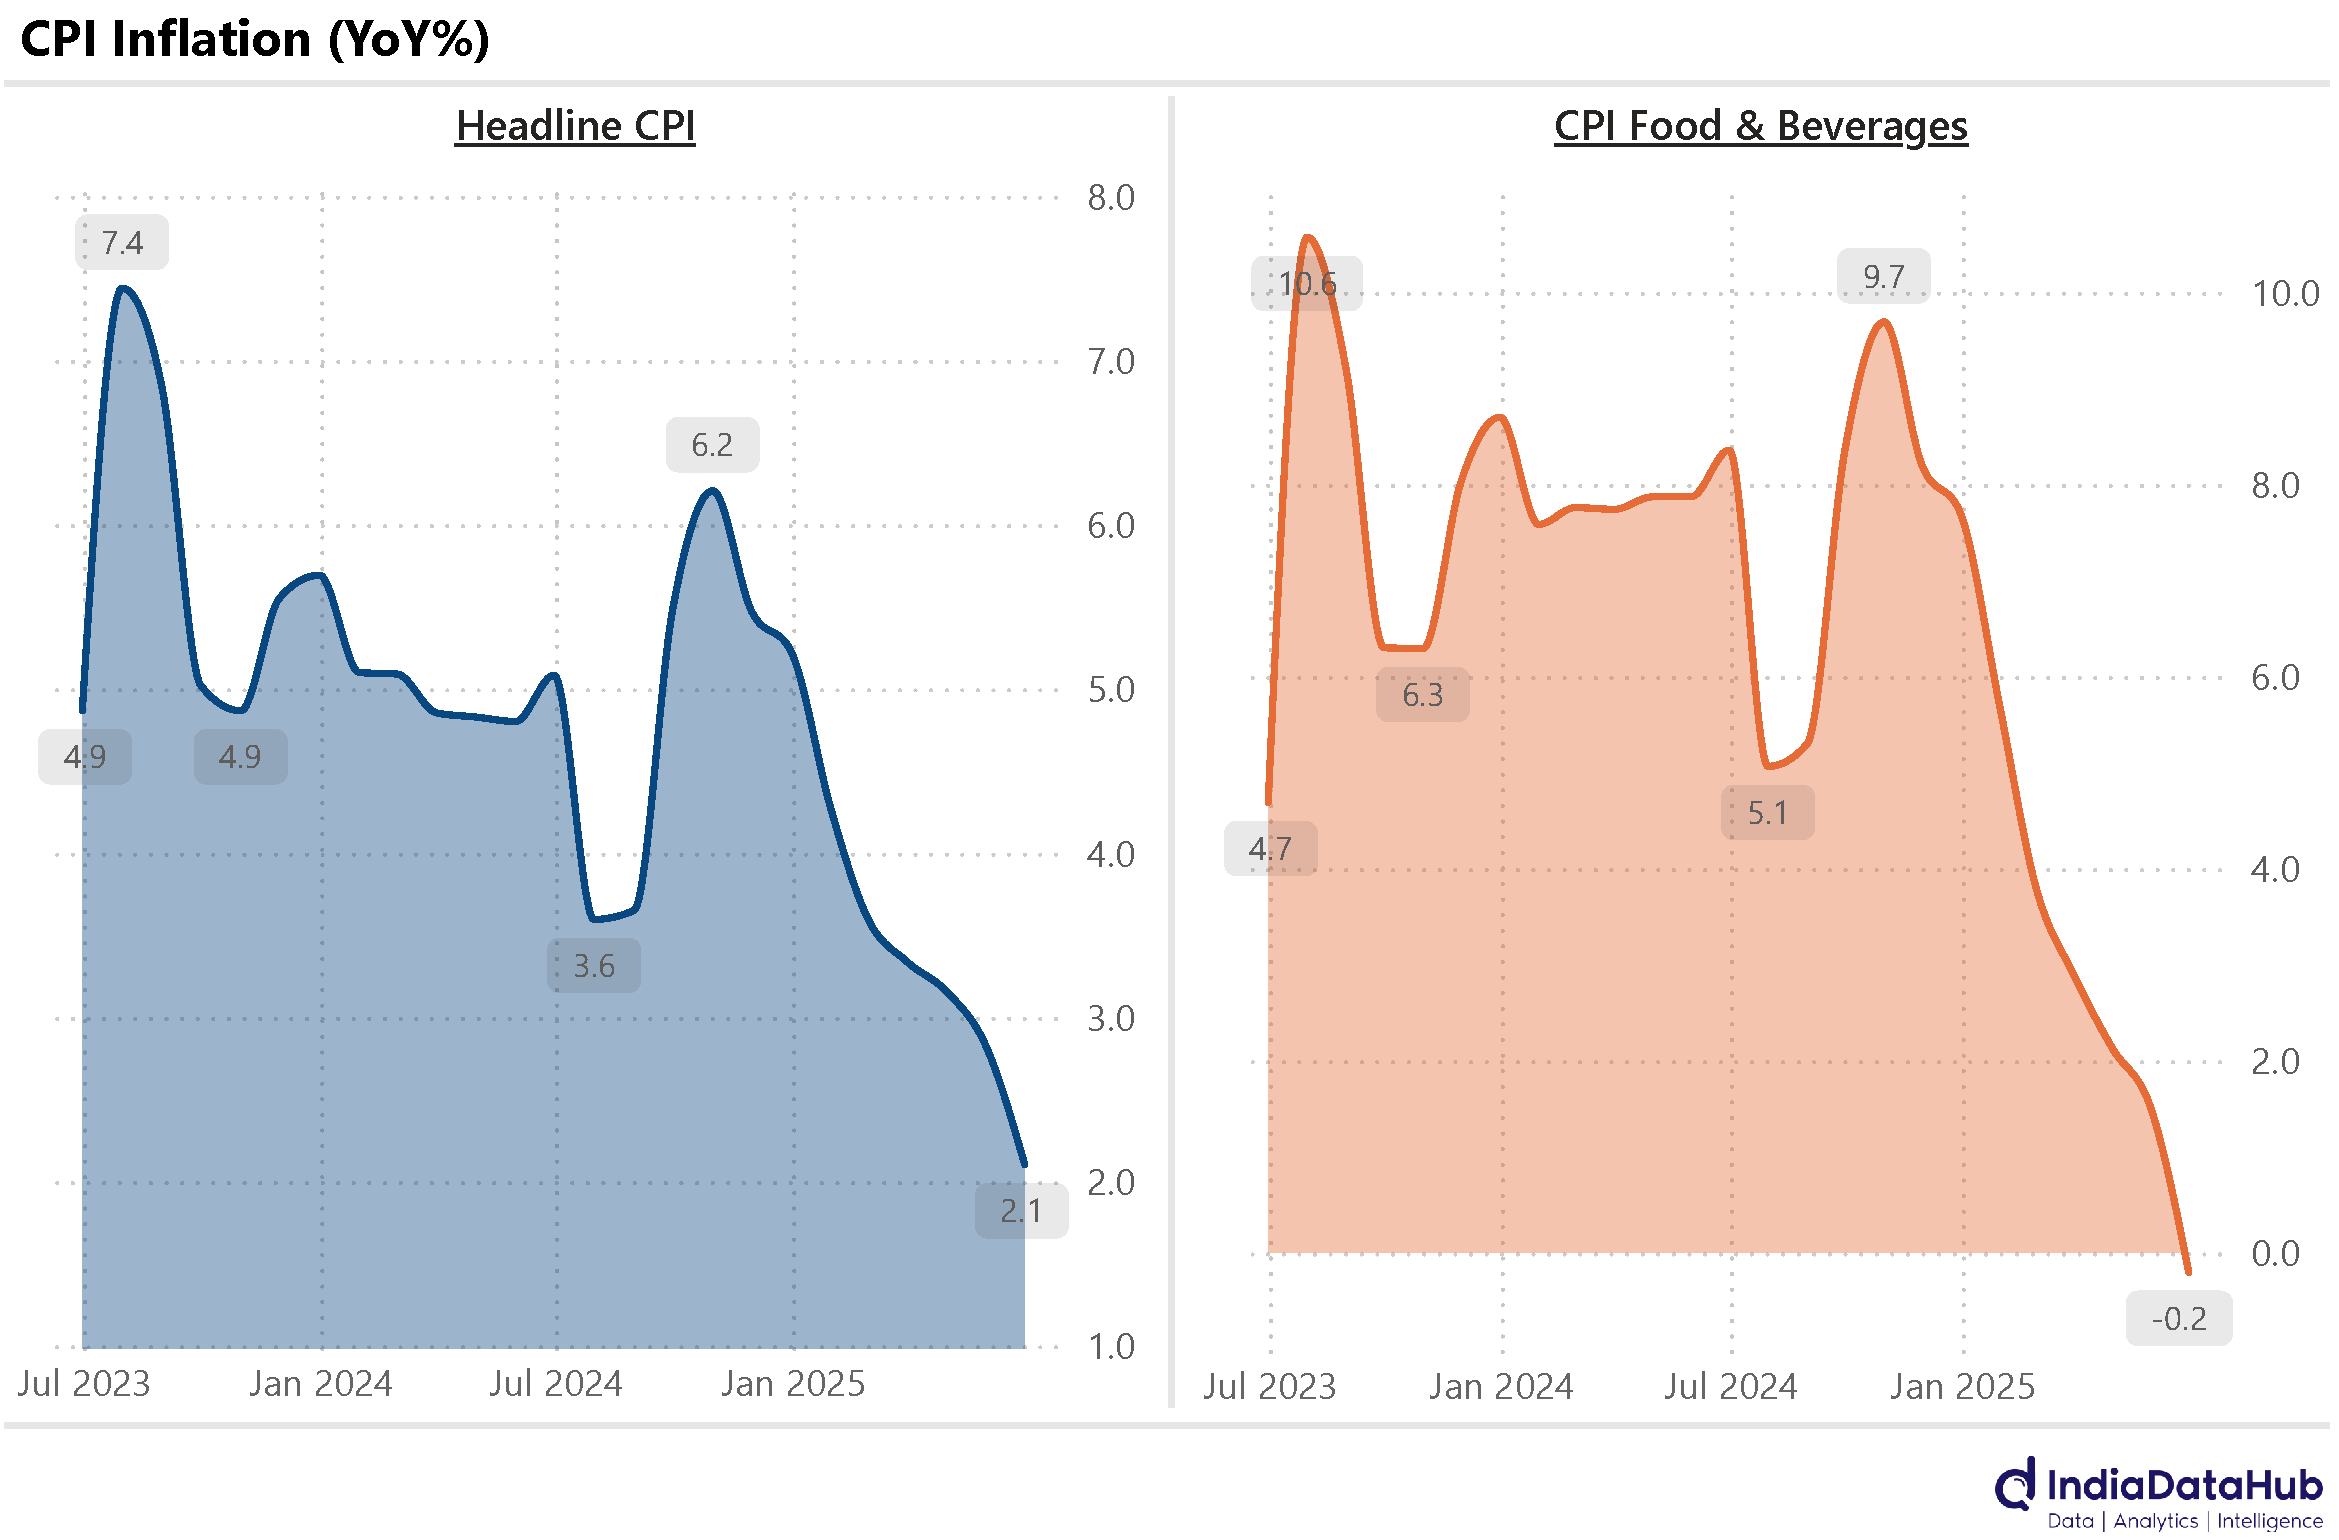
CPI Inflation fell to multi year low in June but core CPI is picking up
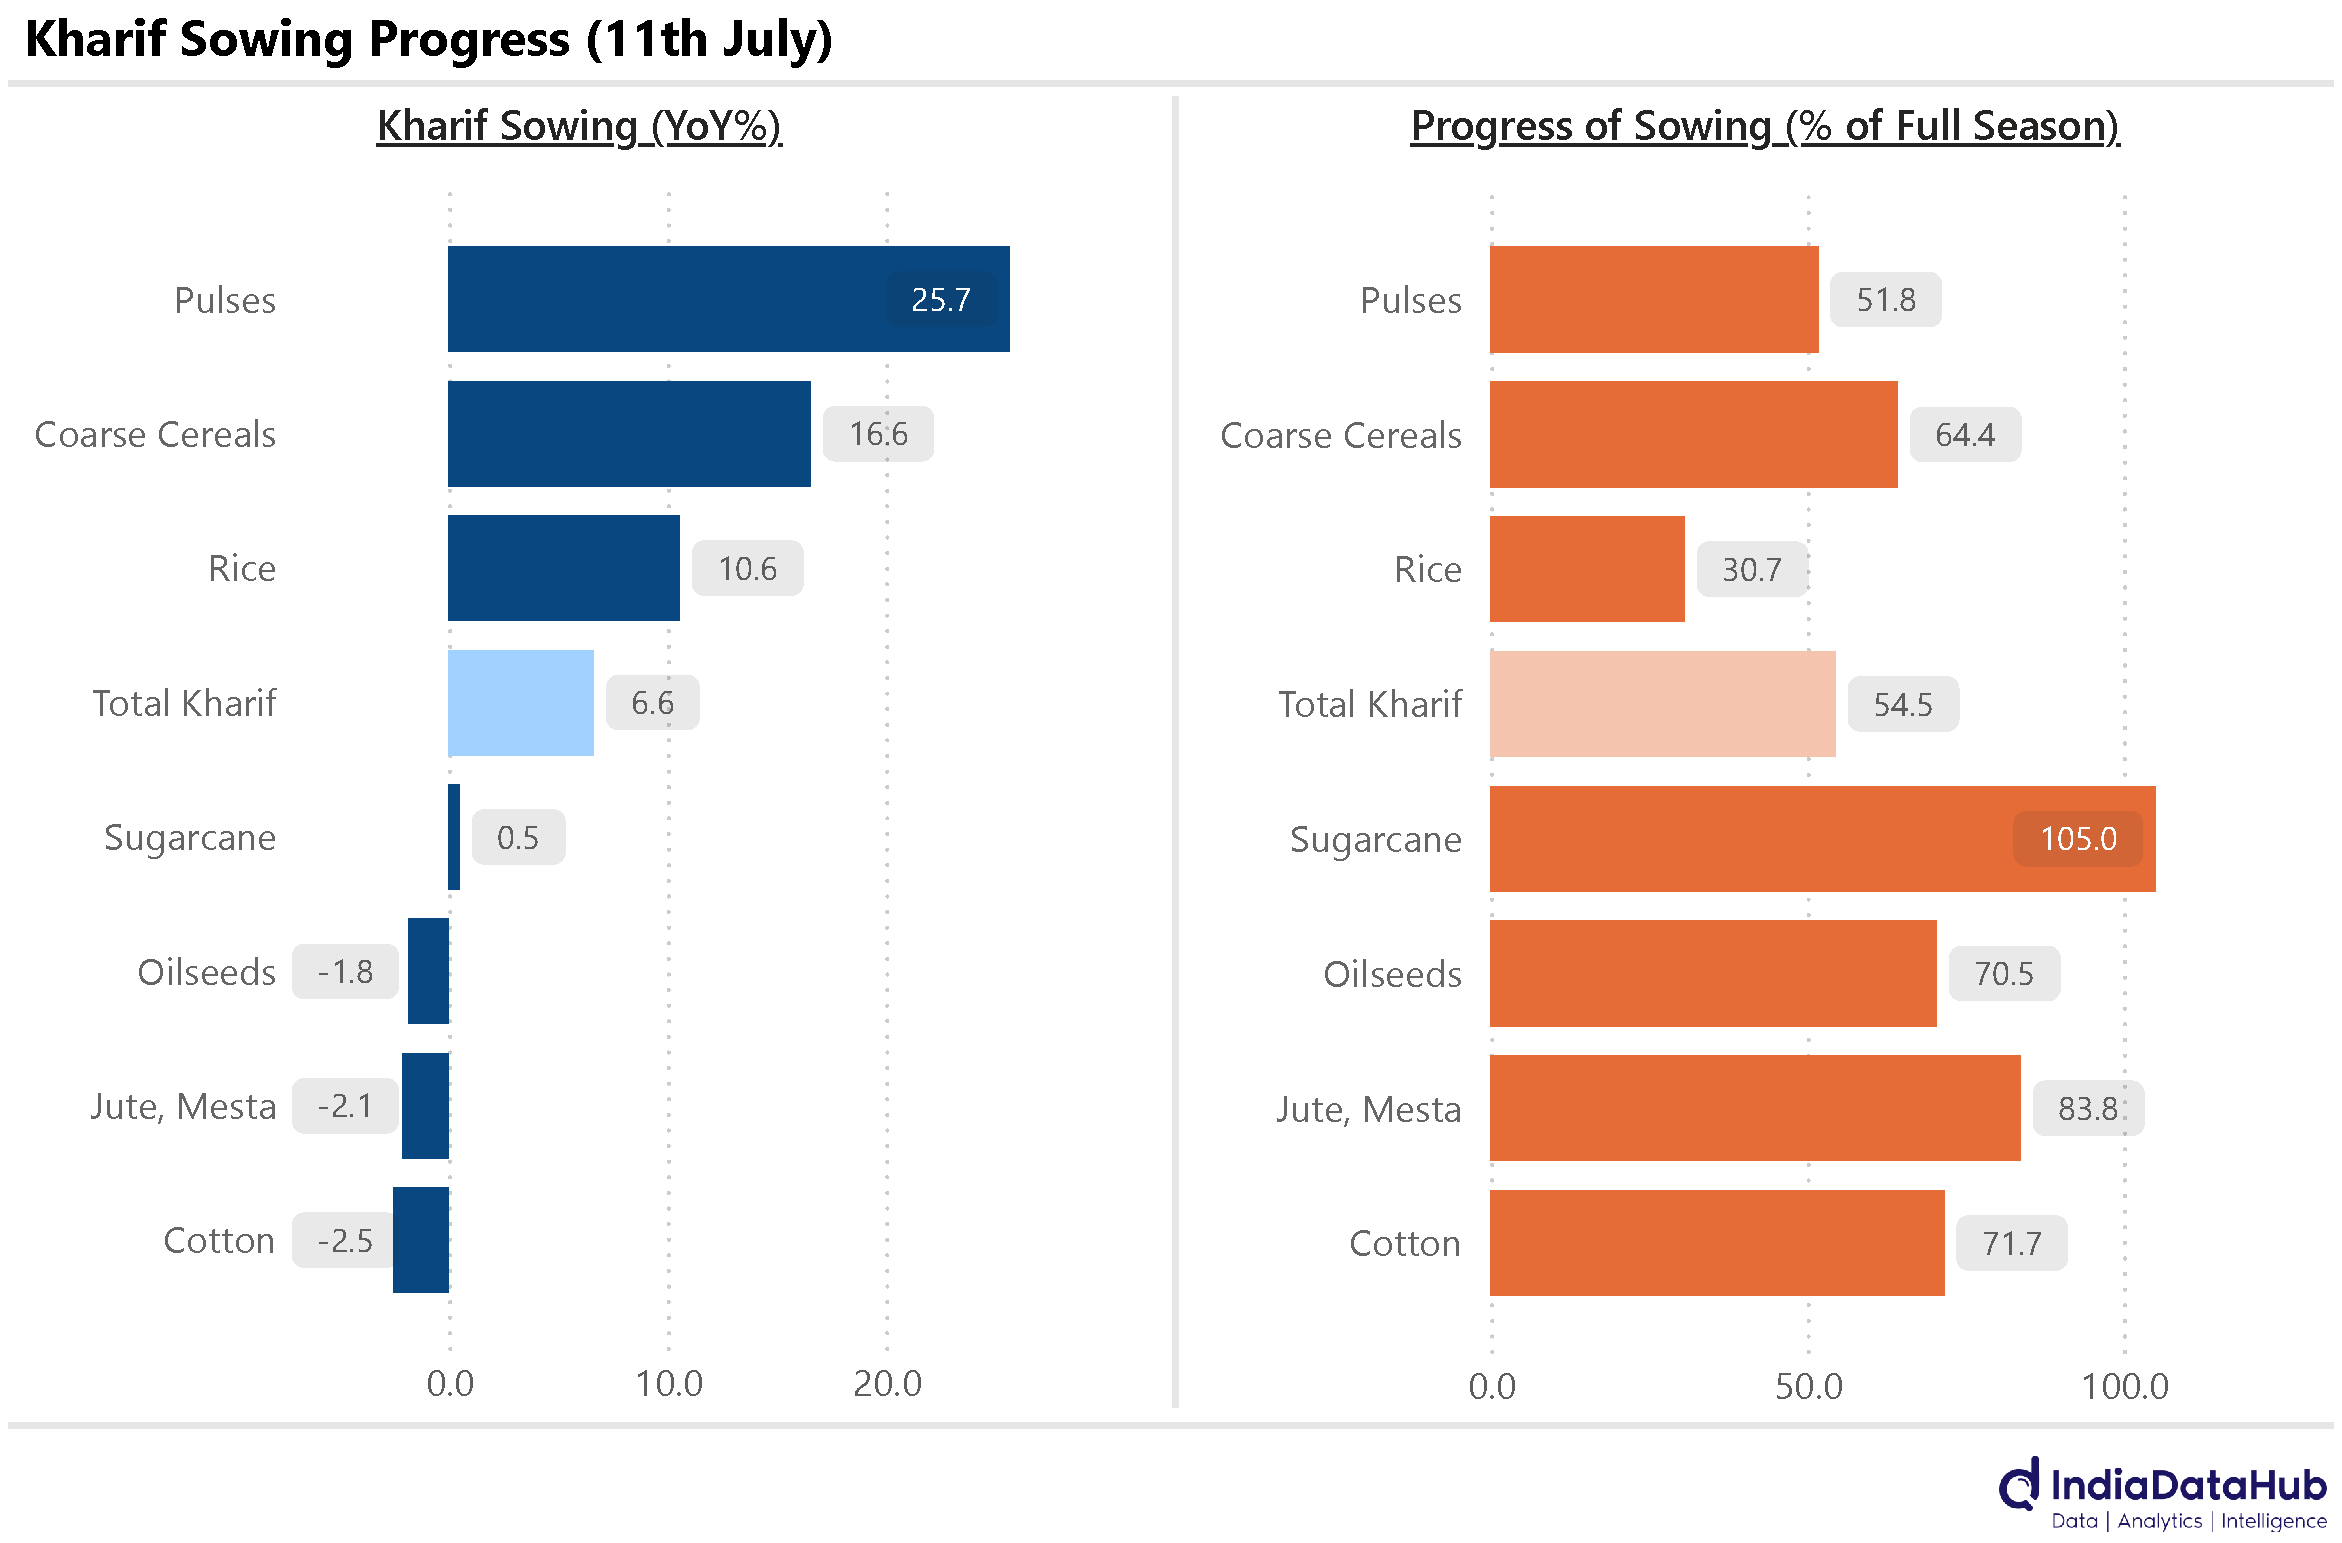
Kharif sowing is off to a strong start
Fertiliser sales are growing and availability remains high
China’s exports continue to outpace imports
China’s trade surplus is on track to cross US$1tn in 2025
India’s merchandise exports remained nearly flat in June (-0.1% YoY), following a 2.2% YoY contraction in May. Petroleum exports continued to weigh on overall performance, declining by 16% YoY in June, though this marked an improvement from the 30% decline recorded in May. Excluding petroleum products, exports rose 3%.
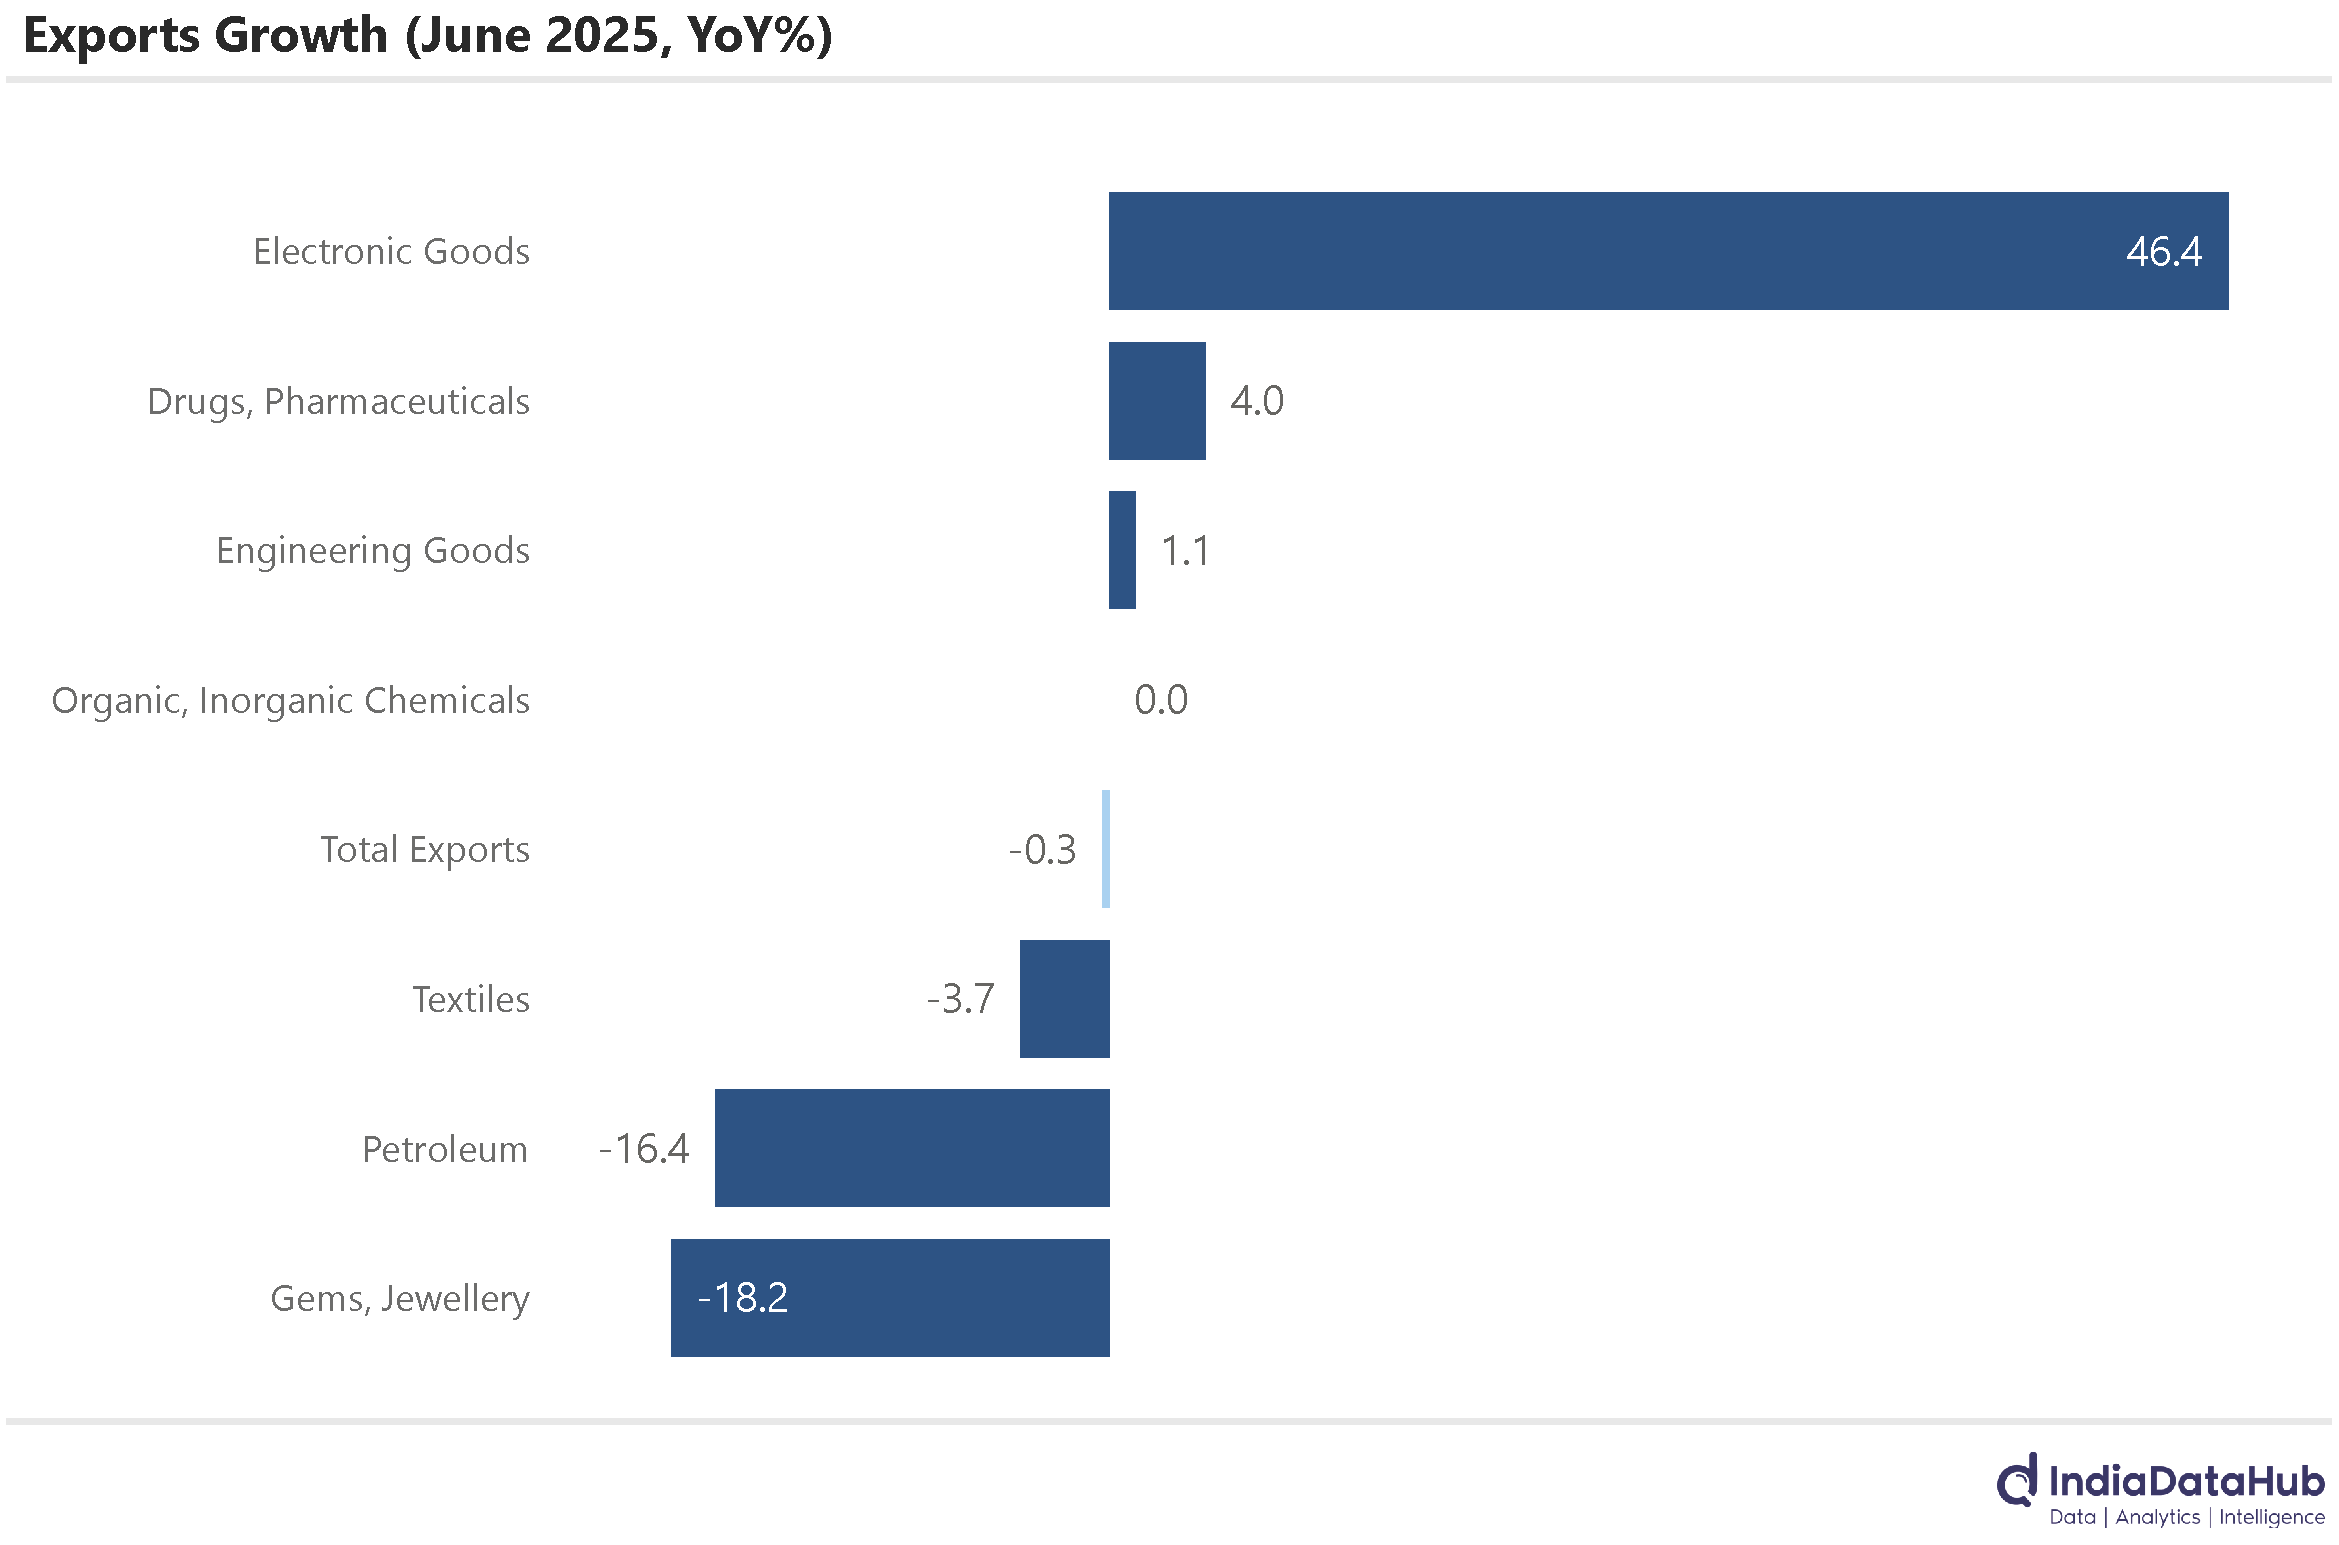
Merchandise imports declined for the second consecutive month in June, registering a decline of 3.7% YoY. Gold imports decreased by 26%, a steeper decline from a 13% decline in May. Crude oil imports fell by 8% YoY, though the pace of contraction moderated compared to the previous month.
With export growth remaining flat and imports registering a moderate decline, the merchandise trade deficit narrowed to US$18.8 billion in June, according to preliminary estimates.
Consumer Price Index (CPI) inflation decreased by 70bps from the previous month, reaching 2.1% in June. This represents the lowest monthly inflation rate recorded since January 2019. The sharp fall is entirely due to lower food inflation. Food and Beverage inflation was -0.2% in June, the first time it has been negative in several years. And Vegetables' is the key driver of lower food inflation – Vegetable price inflation was -19% YoY in June.
Core CPI (excl food & fuel) rose further and at 4.4% it is the highest since September 2023. Even excluding the retail fuel and precious metals component of core CPI, the core-core CPI inflation rose to 3.6% YoY in June, and it is the highest since December 2023. So while the headline CPI remains benign, the sticky bits of CPI have started to inch up.
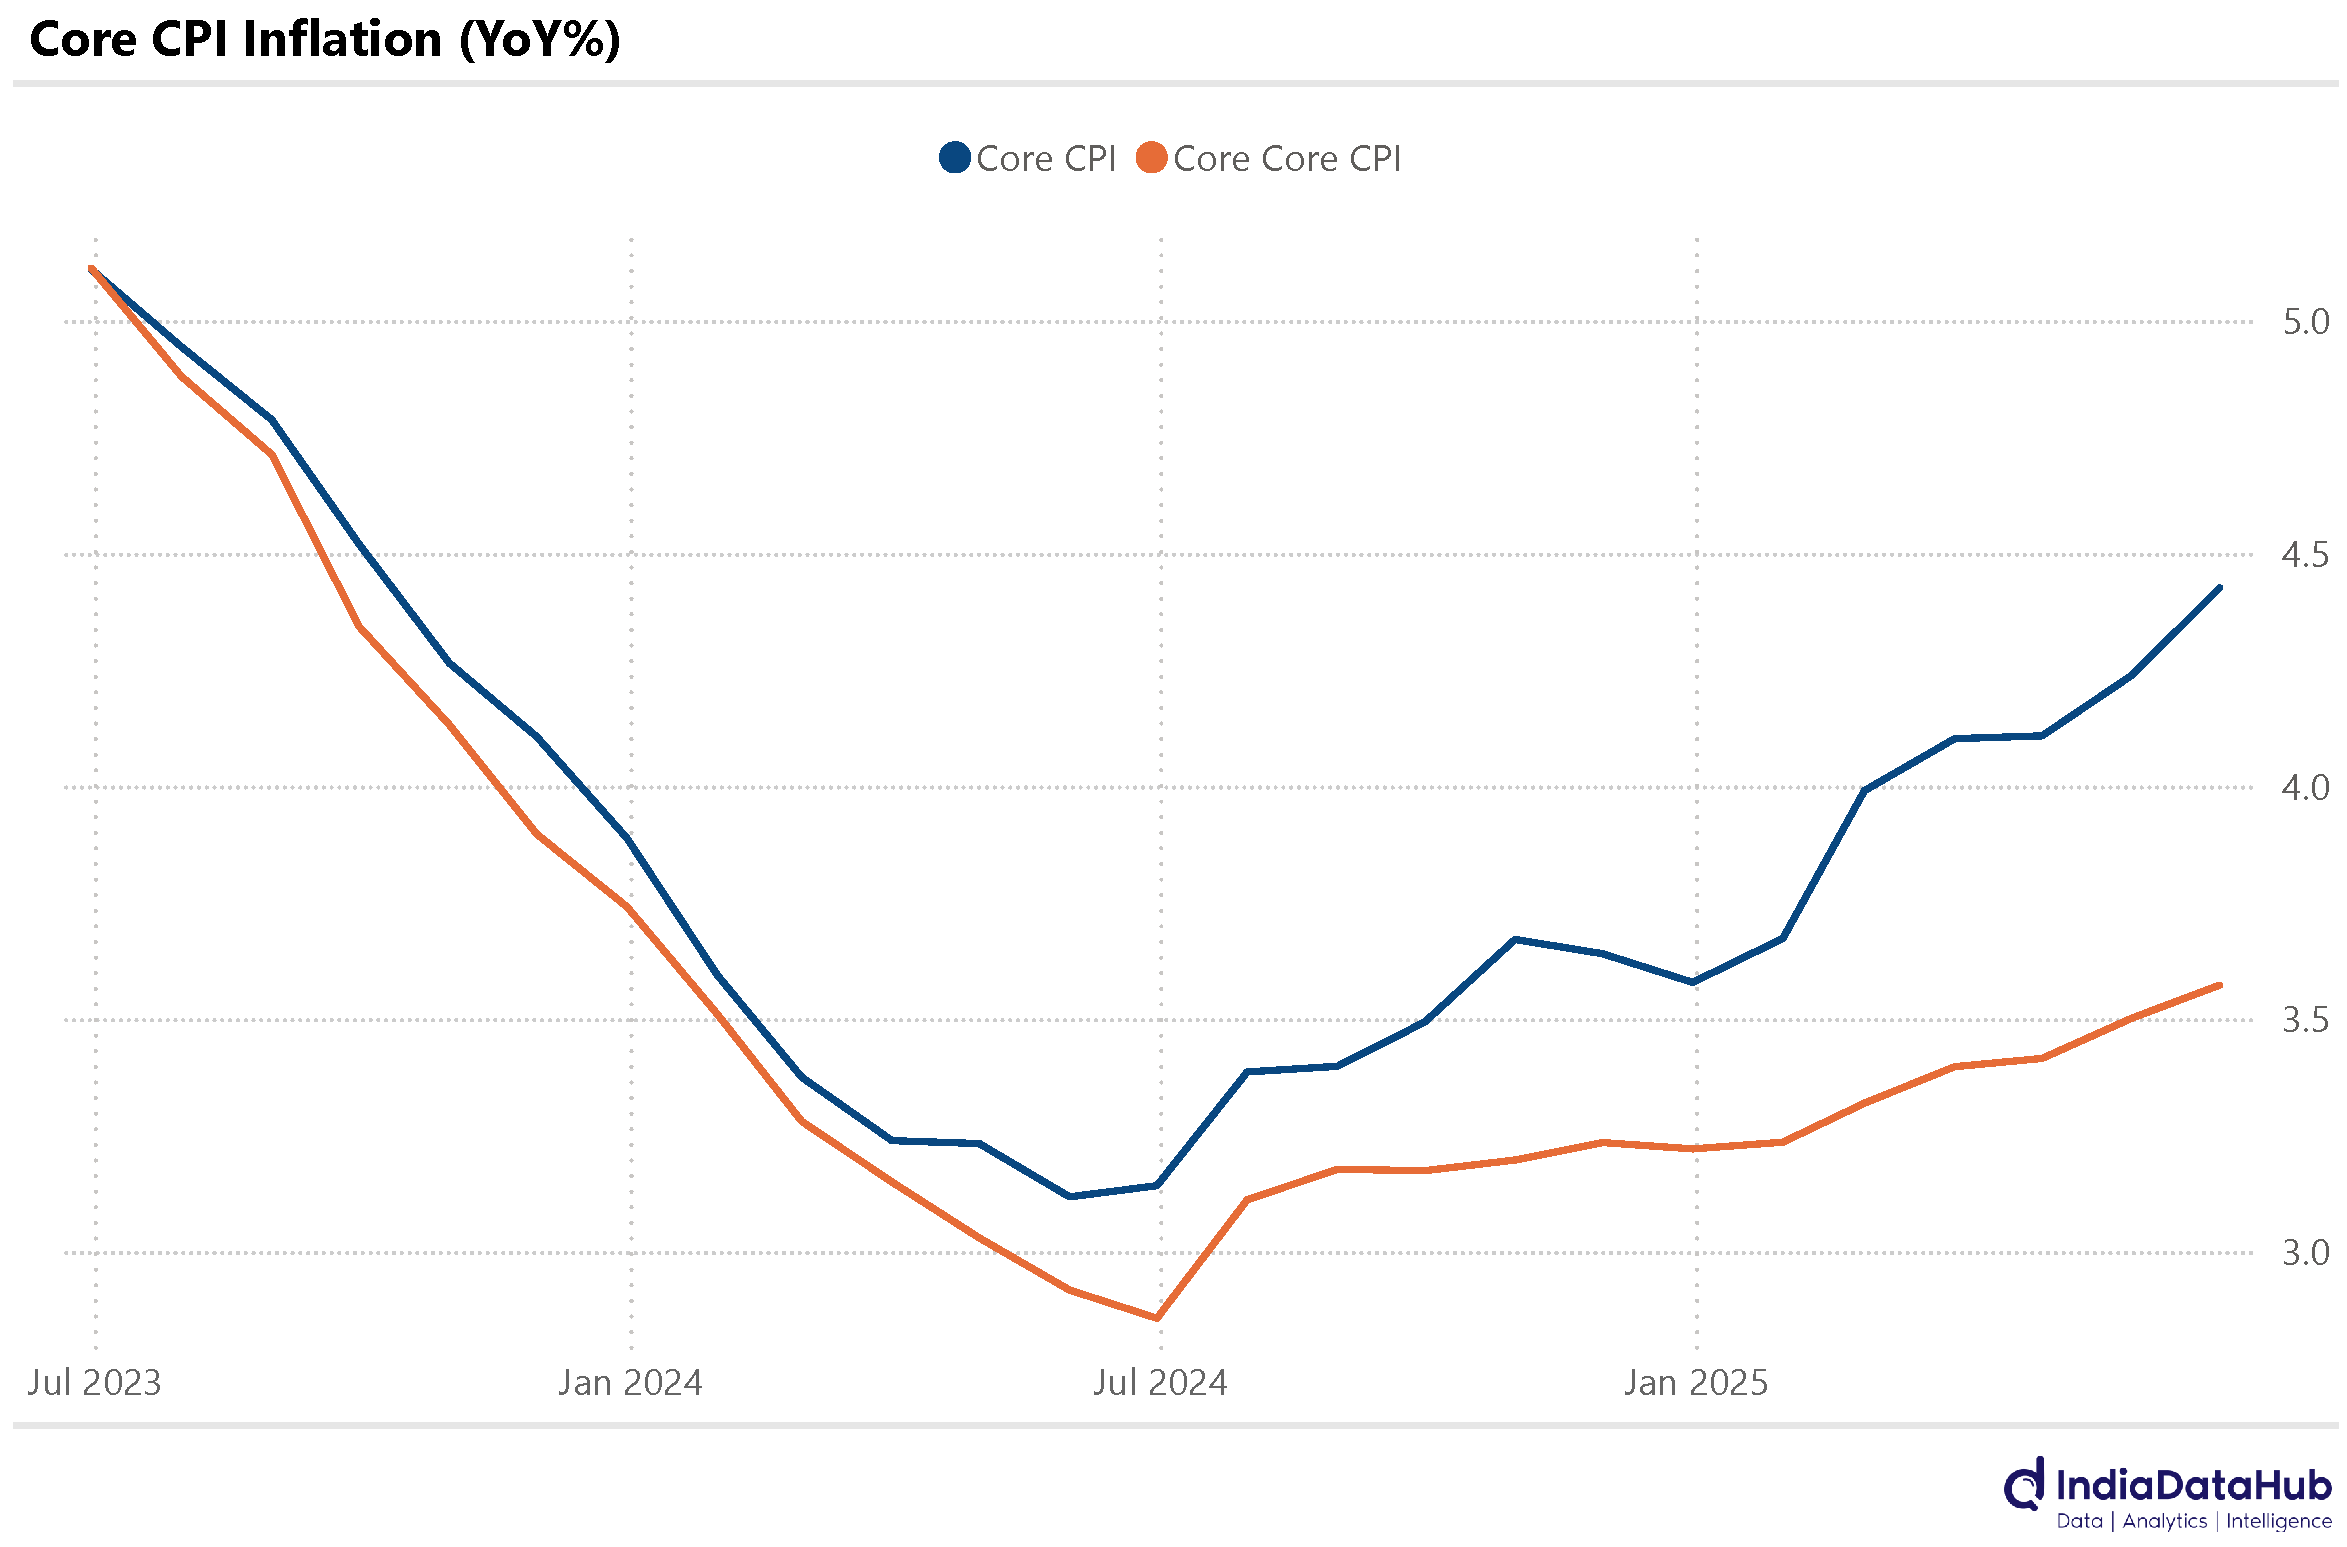
The question, therefore, is whether this sharply lower headline CPI makes a sufficient enough case for another rate cut next month or is the rising core reason enough for the RBI to exercise caution. Worth noting is that the June monetary policy meeting saw a 50bps reduction in the policy rate with a shift in policy stance from accommodative to neutral. Therefore, objectively speaking, the RBI ought to stay on hold in August and only act if the lower CPI print sustains for a few months.
Kharif sowing has got off to a strong start this year. As of 11th July, the total Kharif acreage is up 6.6% YoY. Foodgrains in particular are seeing a double-digit increase in acreage, with the acreage of Pulses up 25% YoY and that for Rice up 11% YoY and Coarse cereals 16% YoY. On the other hand, the sowing for Cotton and Oilseeds has lagged so far, with acreage for both currently running lower than last year. These are still early days, with almost half of the total sowing still pending.
Separately, after 3 consecutive months of decline, Fertiliser sales saw a modest 1% YoY growth in June. Urea sales surged by 17% YoY, the fastest growth among different fertilisers. While DAP sales continued to decline – they declined 7% YoY in June – the pace of decline is moderating sequentially.
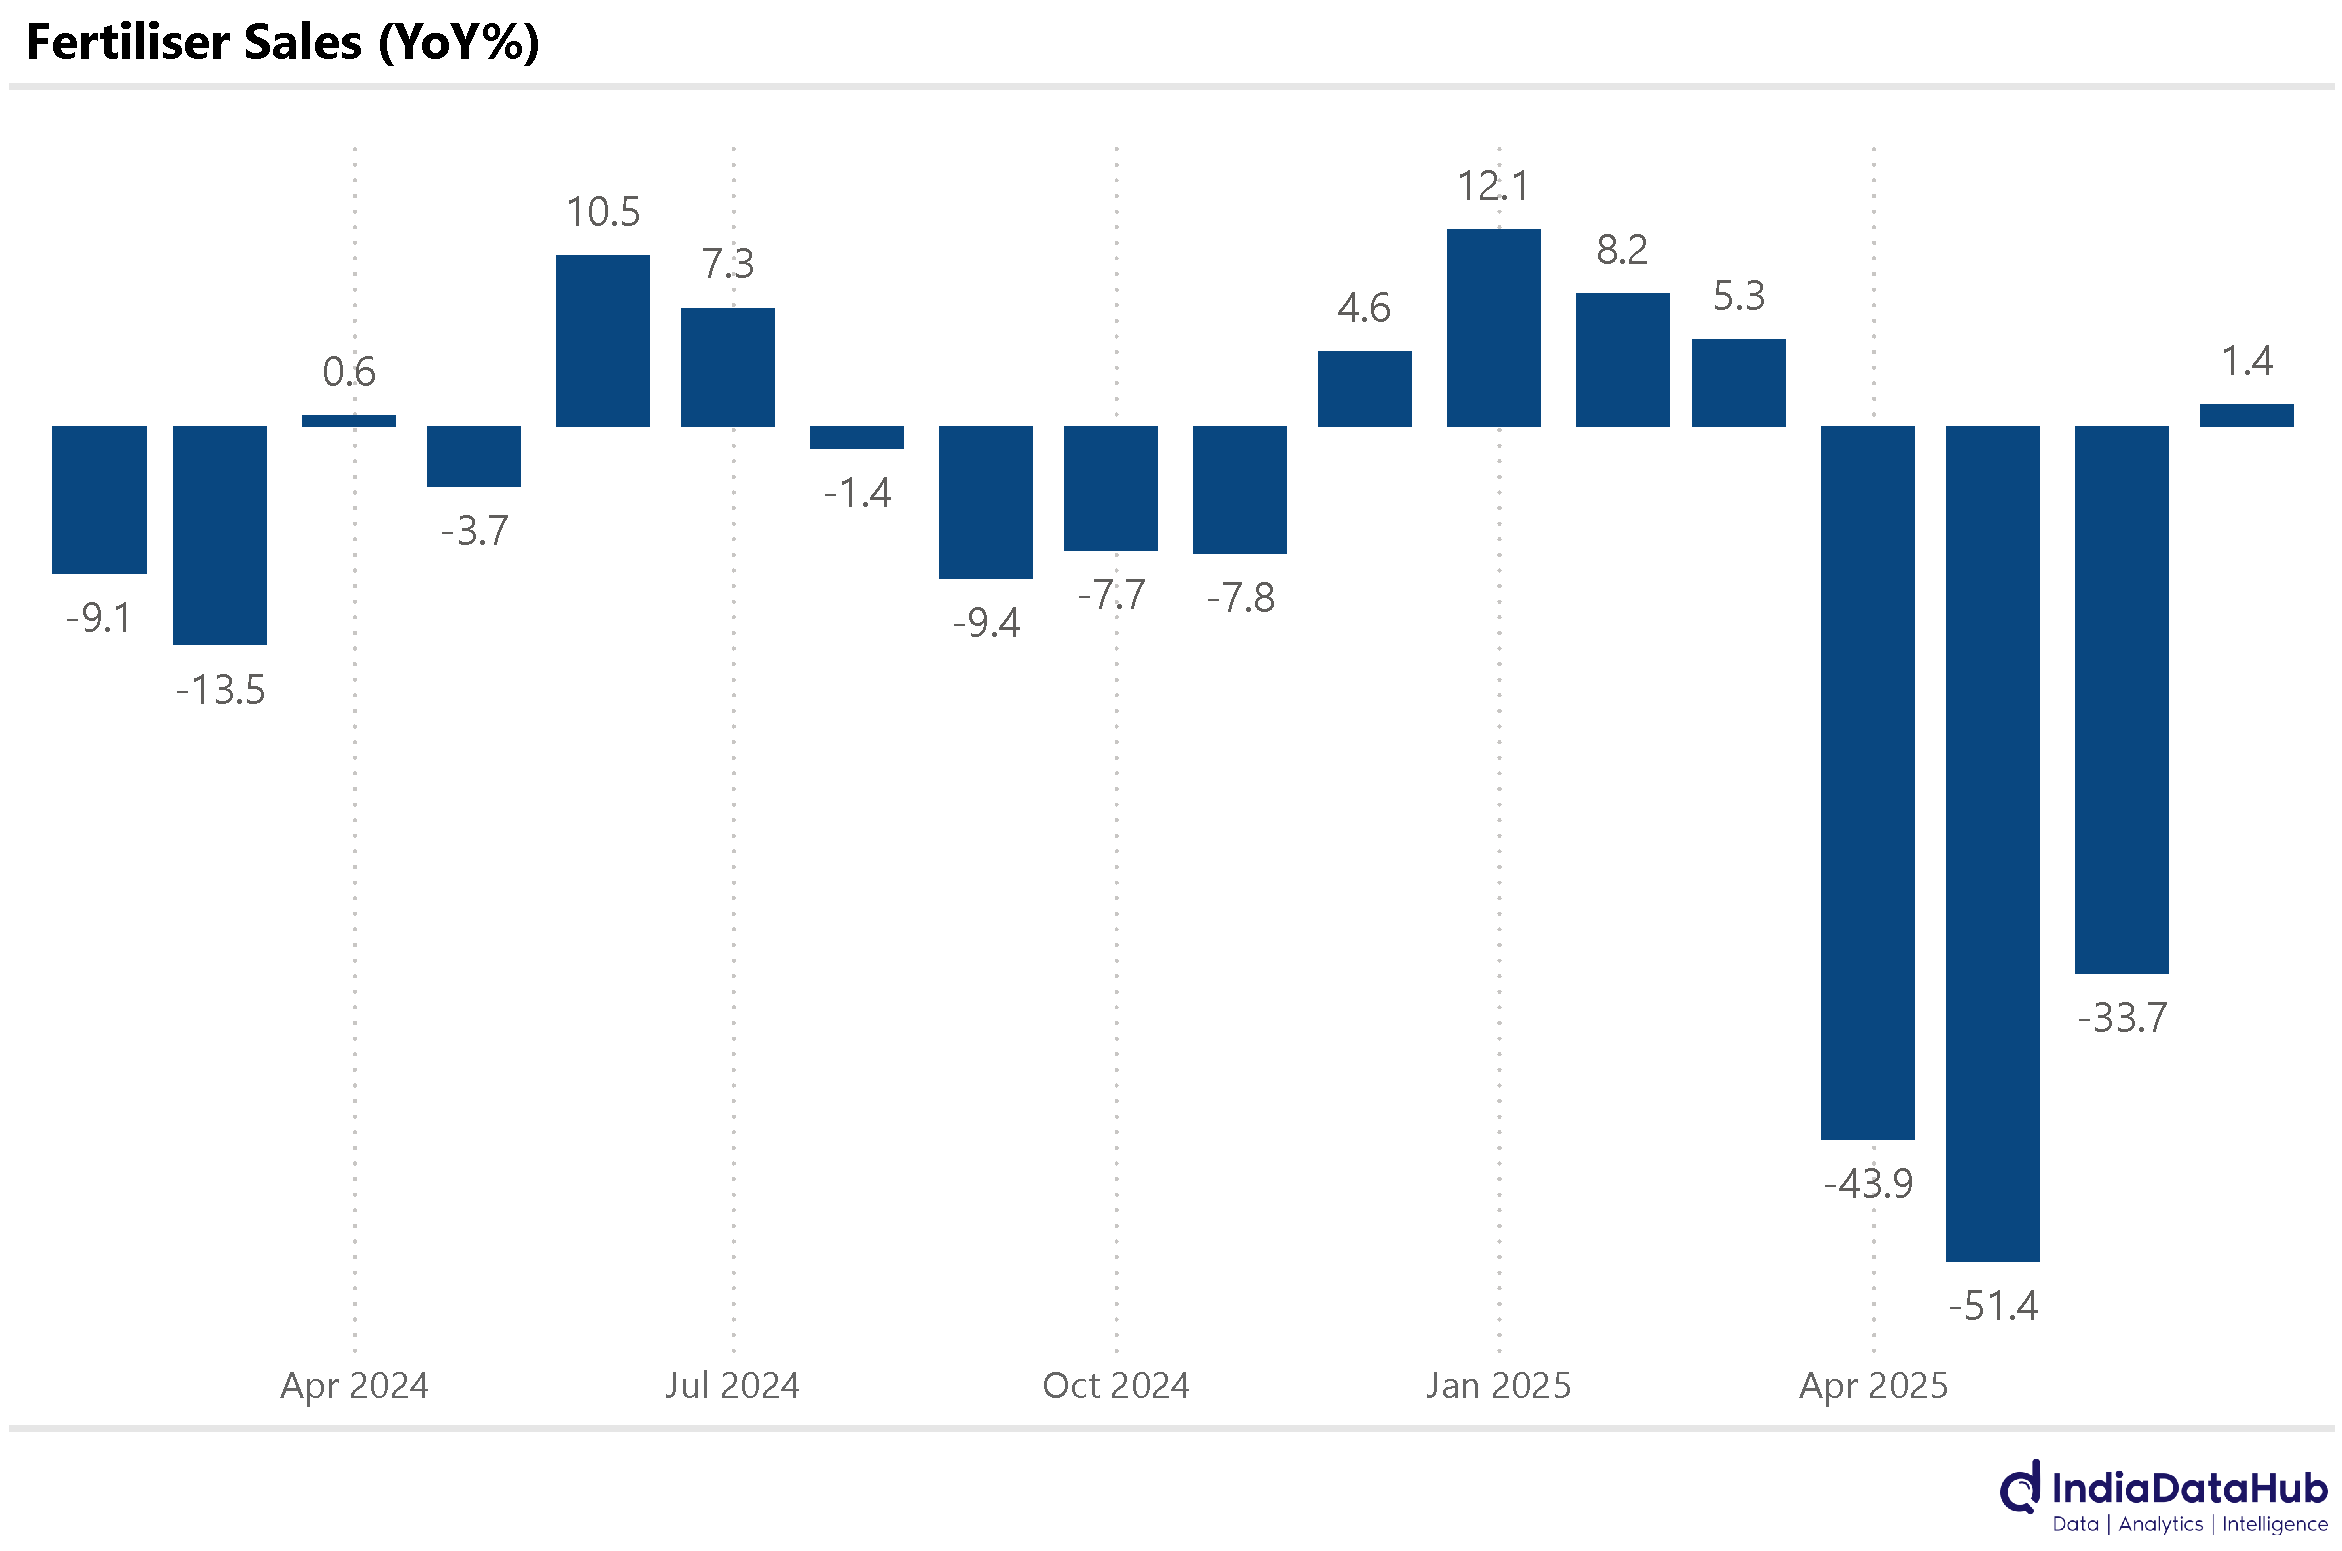
Importantly, despite a 14% decline in domestic fertiliser production during June, the overall availability of Fertilisers in June was more than 2x that of last year. So, as we head into the Kharif season, the overall fertiliser situation looks fairly comfortable.
Lastly, China's merchandise exports rose by 5.9% year-on-year in June, increasing from $307 billion to $325 billion, while imports edged up by 1.1% to $210 billion. Export growth was supported by higher shipments of machinery and electrical equipment, which rose by 7.5%, and transport equipment, which surged by 16.7%, although exports of base metals and related products declined slightly by 0.7%. Geographically, exports to the United States fell by 16.1% year-on-year, but the pace of decline was lower compared to May. Exports to Hong Kong and Vietnam recorded robust growth of 18% and 23%, respectively.
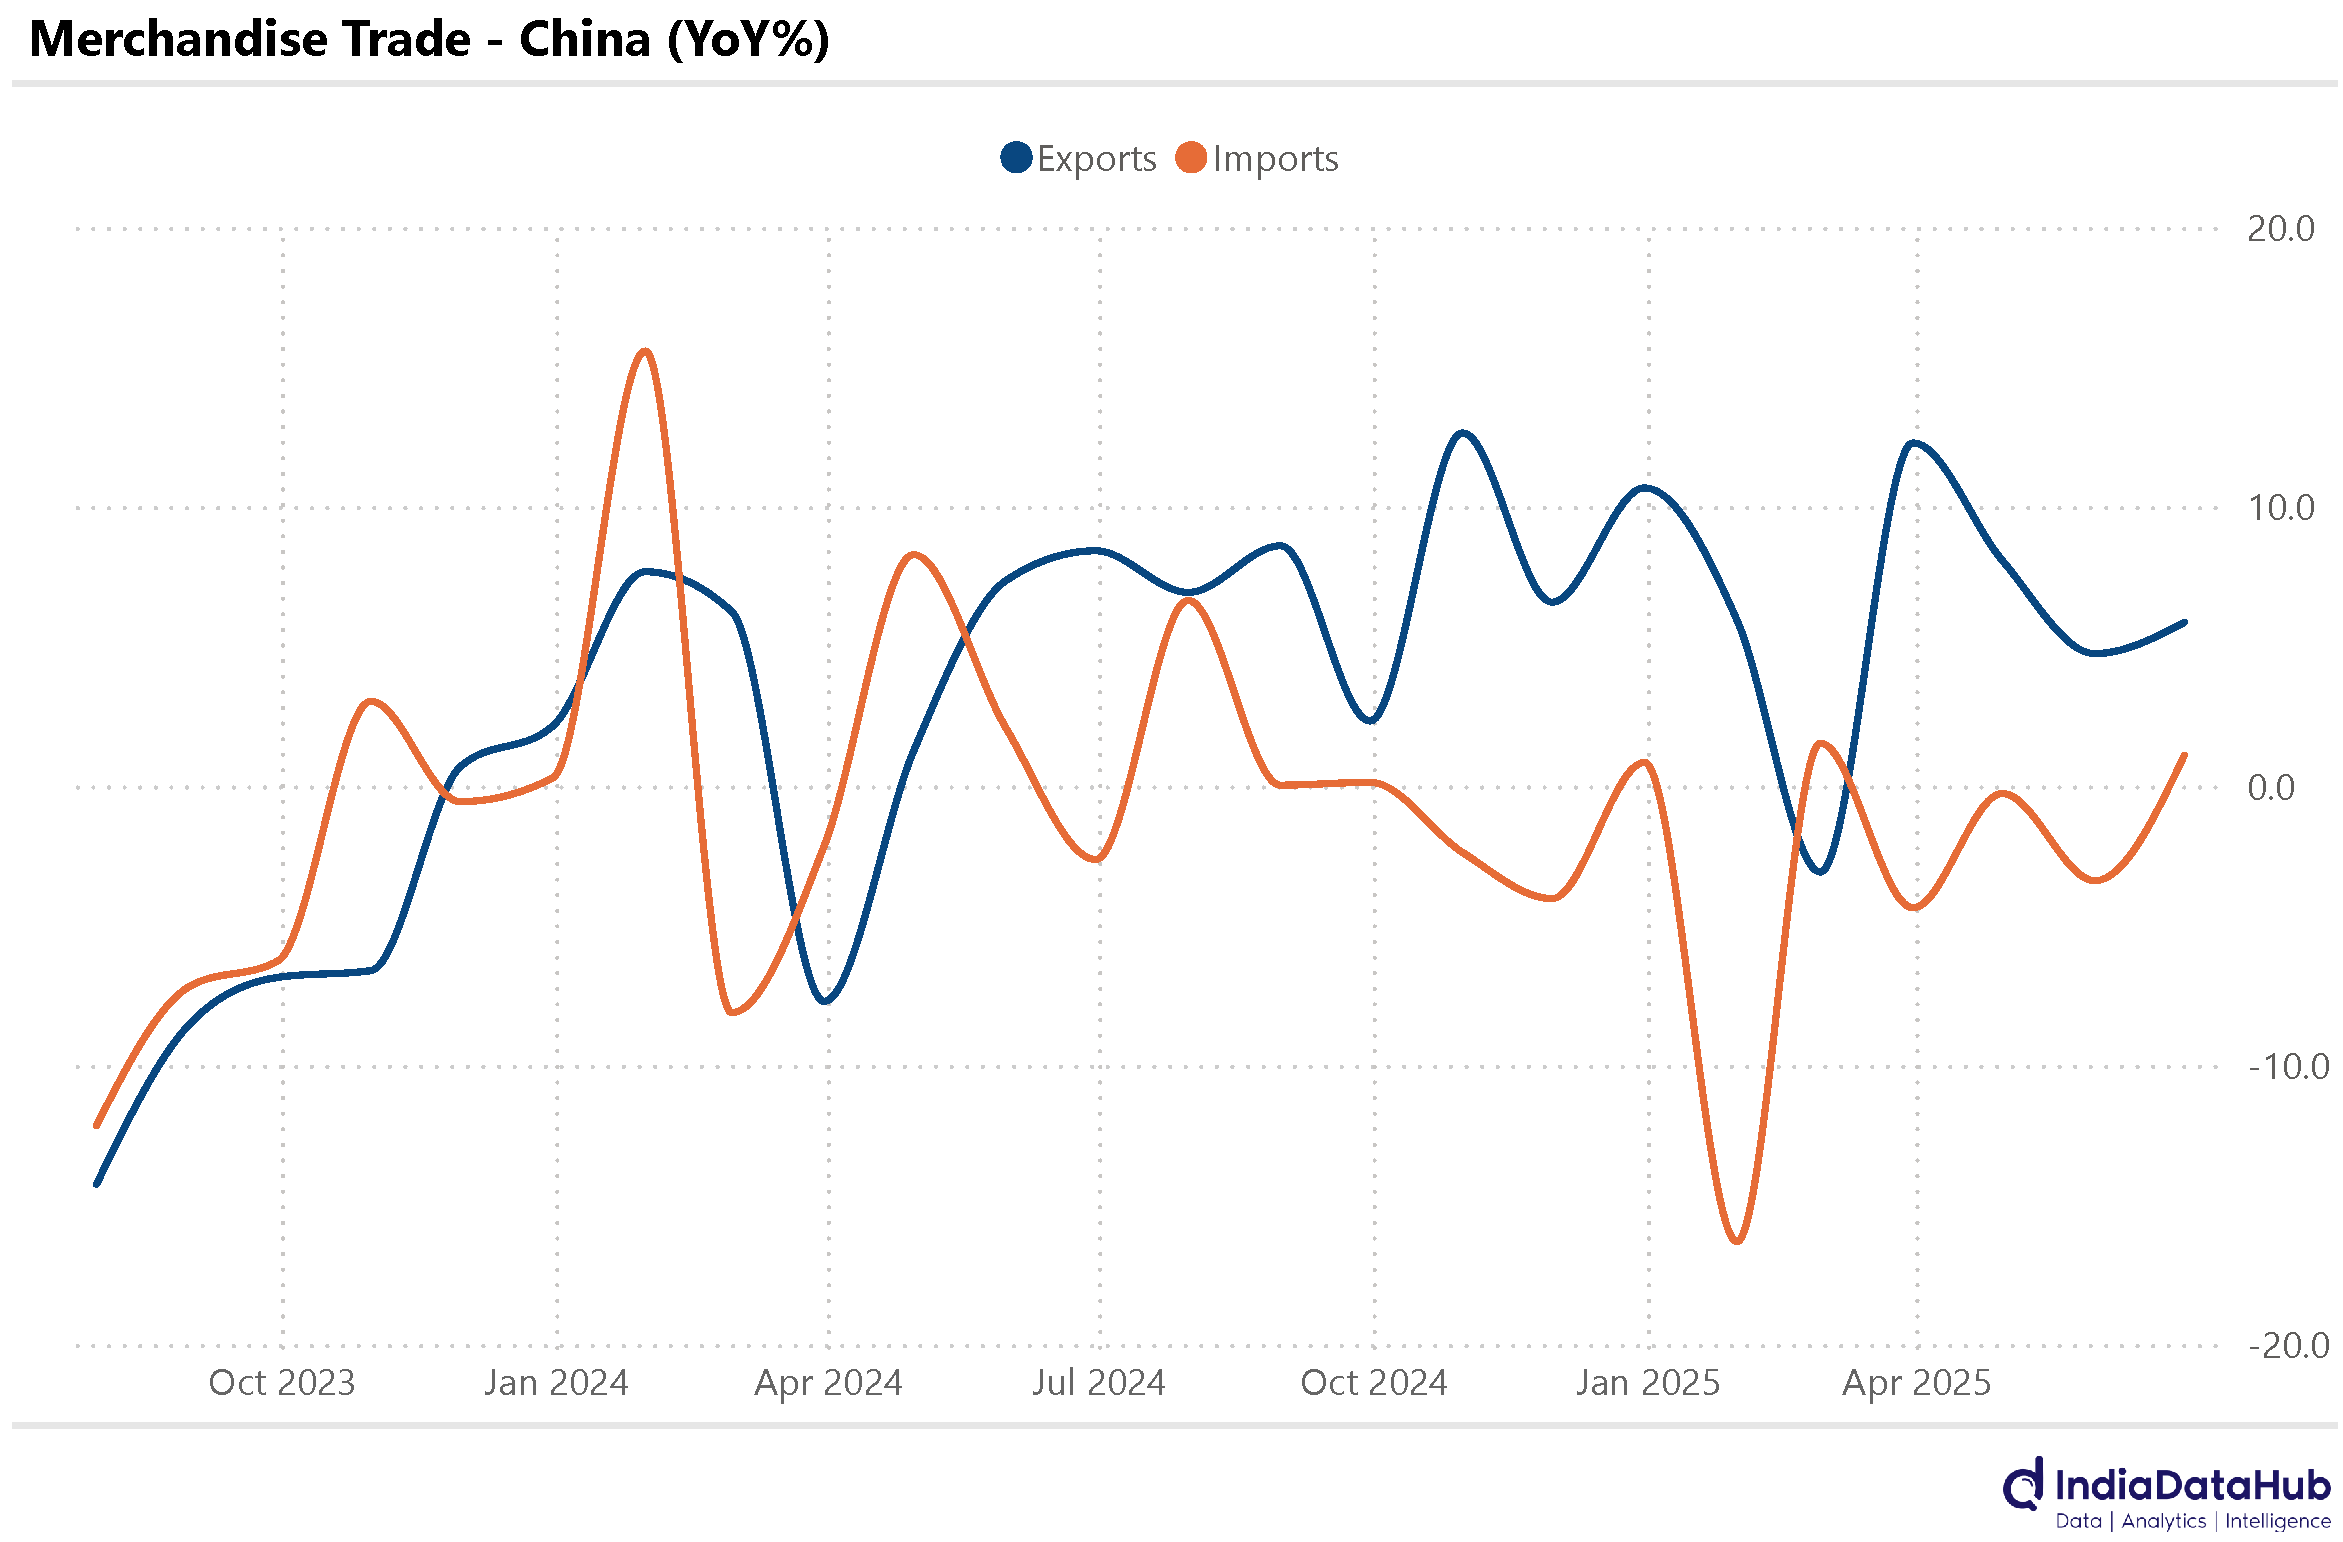
On the import side, purchases of machinery and electrical equipment increased by 8.8%, while imports of mineral products fell by 9.2%. Notably, imports of precious stones and metals saw a sharp increase of 46.3%. Imports from the United States declined by 14.8% year-on-year, whereas imports from Hong Kong rose significantly by 39.2%.
Stronger growth in exports relative to imports resulted in a sharp 16% year-on-year expansion in the trade surplus, which reached $114.75 billion. Worth noting is that since April 2024, China’s exports have grown faster than imports in all but 2 months. Consequently, YTD (Jan-Jun), China’s trade surplus has increased by a staggering 35% YoY to US$586bn. At this rate China’s trade surplus for 2025 will cross US$1tn or ~25% of India’s GDP!
That’s it for this week. See you next week…