
Heat wave, Power Gen picks up, Petro demand declines and more...
This Week In Data #161
In this edition of This Week In Data, we discuss:
Power Generation picks up supported by Renewables
Temperatures are rising and South is facing the brunt
Oil product consumption declines in April, driven by LPG
Price of India’s basket of crude Oil is at an all-time high in INR terms
Oil Imports will rise to decadal high this year relative to GDP
China’s foreign trade continues strong upward trajectory
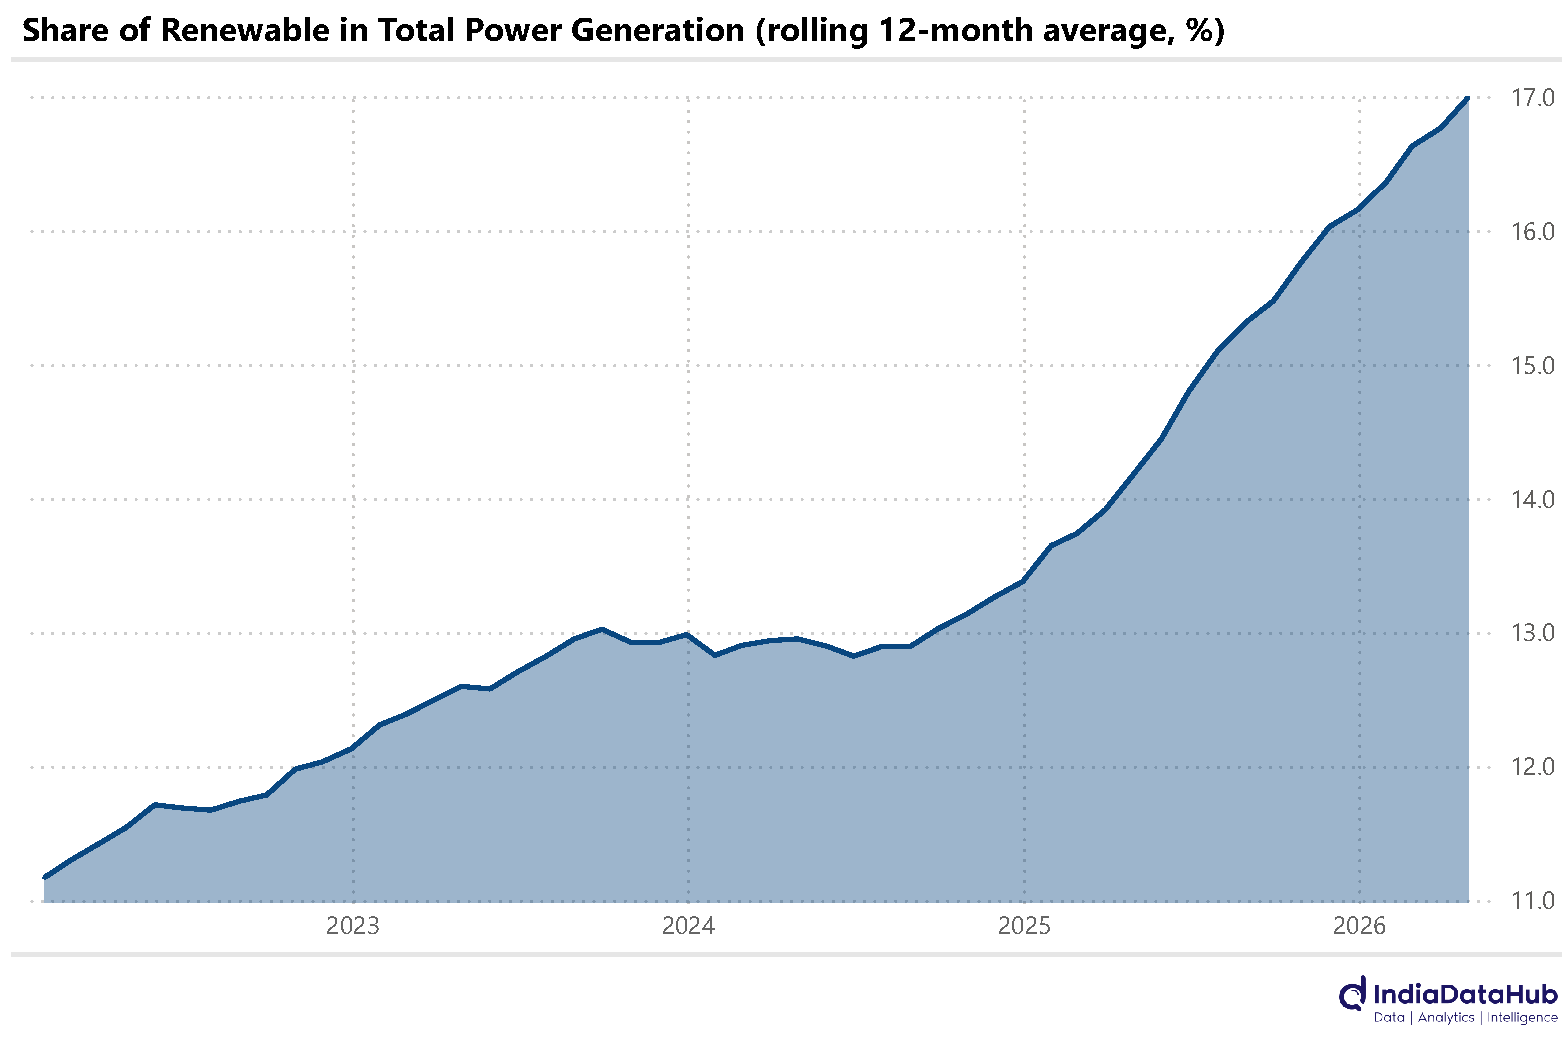
The soaring heat of the last few weeks has resulted in no appreciable increase in power demand. Power generation grew 5.7% YoY in April on a provisional basis. This is the highest growth so far in 2026 and the second-highest growth in the last 16 months (since the start of last year).
And most of the heavy lifting of meeting the incremental demand is coming from renewable sources. Renewable power generation continues to grow at over 20% YoY. Conventional power generation, in contrast, is basically seeing no growth. In April this year, for instance, the total conventional power generation in the country was 137k GWh, the same level as in April 2024. Consequently, the share of renewables in power generation continues to increase, and in April it was 18%. Two years back, in April 2024, it was just 12%.
The interesting thing about the heat wave is that there hasn’t been one. At least not on a pan-India basis. The average all-India max temperature in April was 0.8 degrees lower than last year. And it was also 0.5 degrees lower than the preceding 30-year average for April.
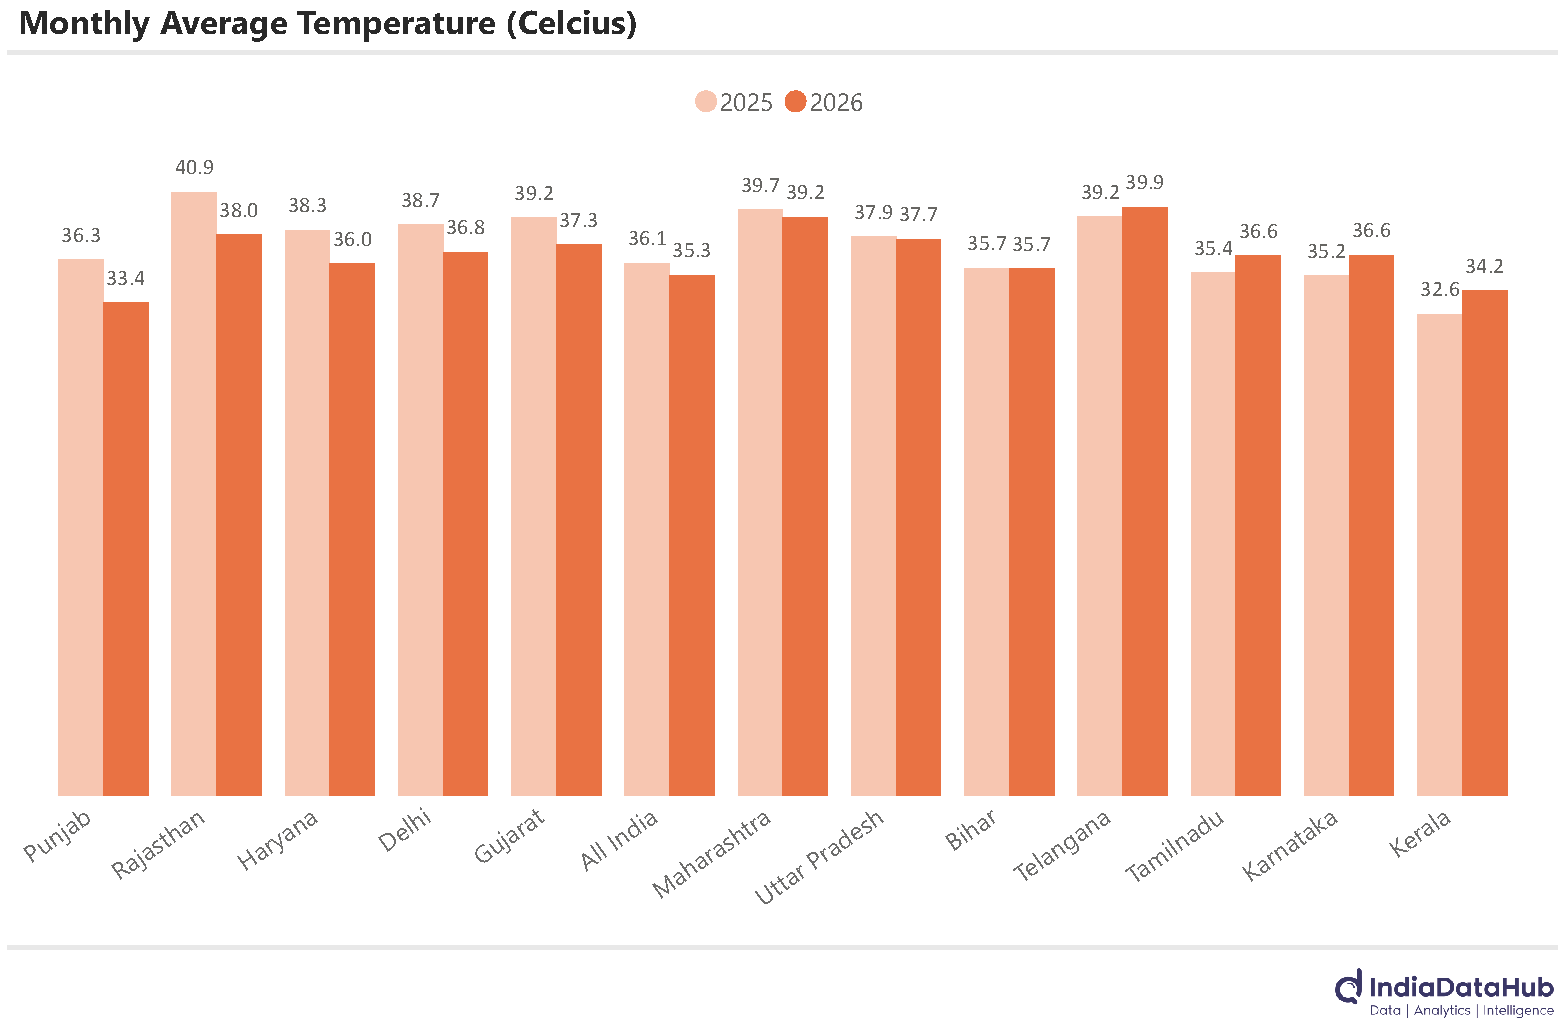
But there is a clear regional divergence. The heatwave is concentrated in South India, while most of North India is seeing, or saw in April, a relatively milder summer. For example, Kerala and Karnataka saw average max temperatures in April almost 1.5 degrees above last year’s. While Rajasthan and Punjab saw average max temperature in April of almost 3 degrees below last year’s.
The impact of the US-Iran war and the consequent disruption to the Oil market is now visible in overall domestic petroleum consumption. Total consumption of petroleum products declined by 4.6% YoY in April, down from low single-digit growth during the first quarter. LPG consumption declined for the second consecutive month – it declined 13% YoY in April and had declined by a similar amount in March.
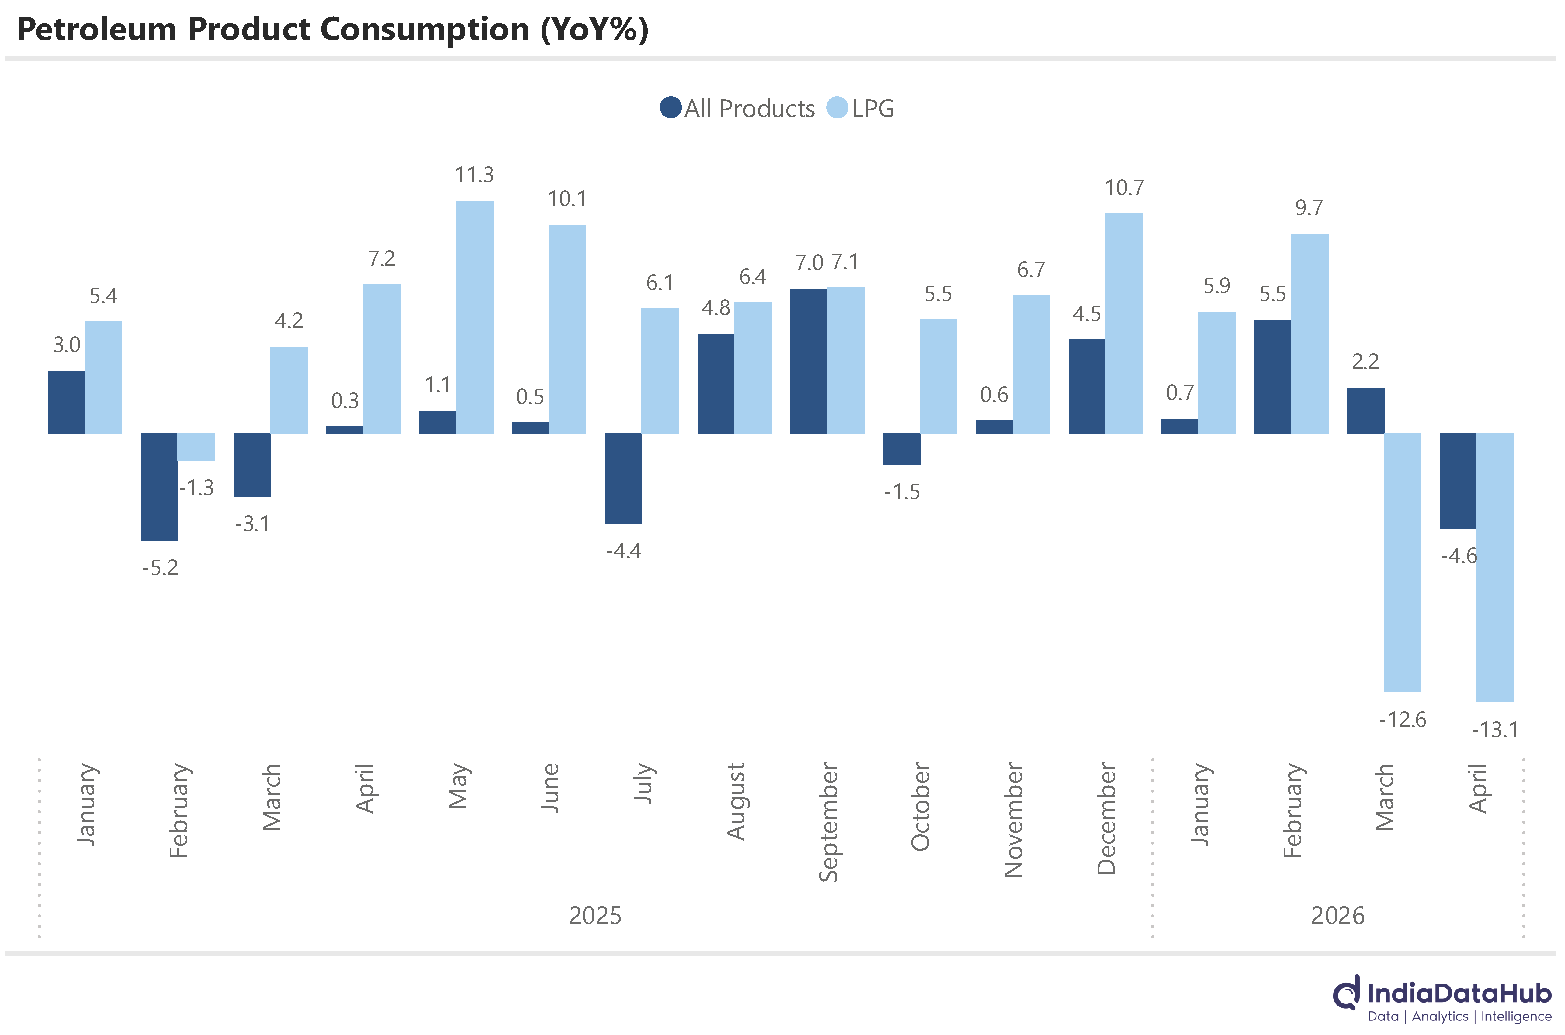
Diesel consumption growth also moderated to below 1% YoY in April as compared to ~5% growth during the first quarter. Note that while retail diesel prices have remained unchanged, commercial diesel prices have increased substantially, and the gap between the two has widened by 70-80%. Petrol consumption, however, has remained resilient, growing by 7% YoY in April, broadly the same pace as in the recent few months.
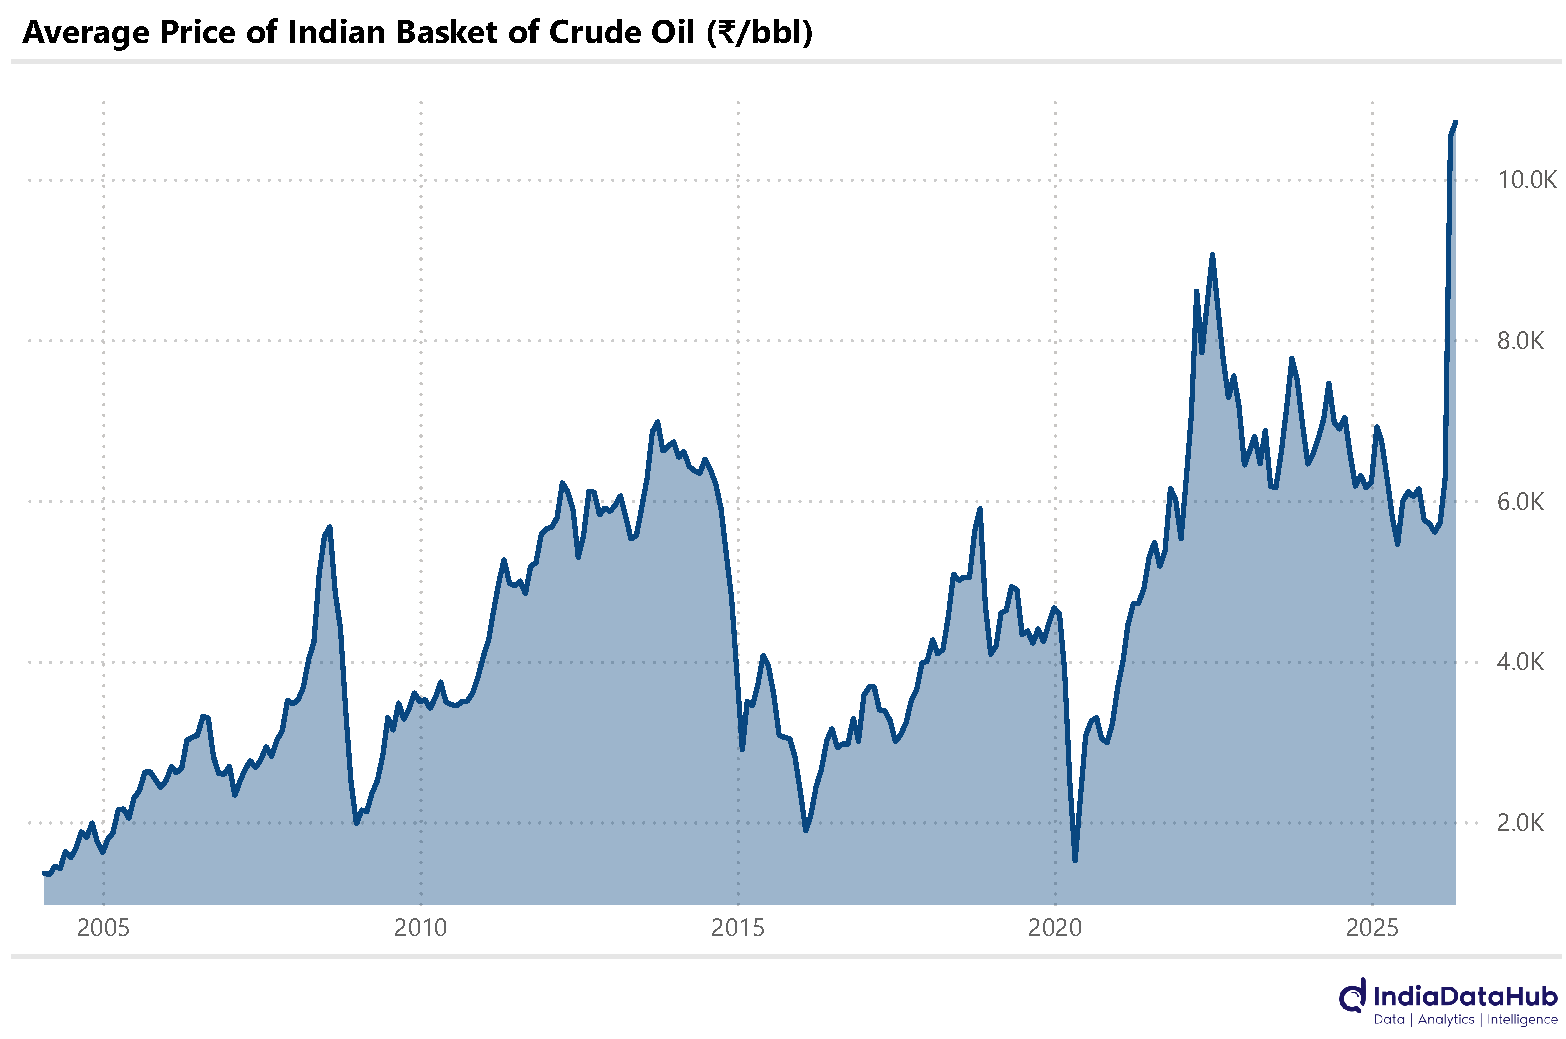
Worth noting is that while in USD terms the price of oil, currently at ~US$115/bbl, is not the highest we have seen, in INR terms it is. In April, the average price of oil for the Indian basket was ₹10,700/bbl, the highest ever. And 90% above the peak of 2008, when it had averaged ₹5700/bbl in July 2008.
On the flipside, the size of the economy has increased significantly, and so oil imports are a lower share of the economy than before. In FY26, for instance, net Oil imports were 3.1% of GDP, as against the last 20-year average of 3.8% of GDP. But given where Oil prices are currently, and if they sustain for the full year, net Oil imports will rise to closer to 5% of GDP, the highest in over a decade.
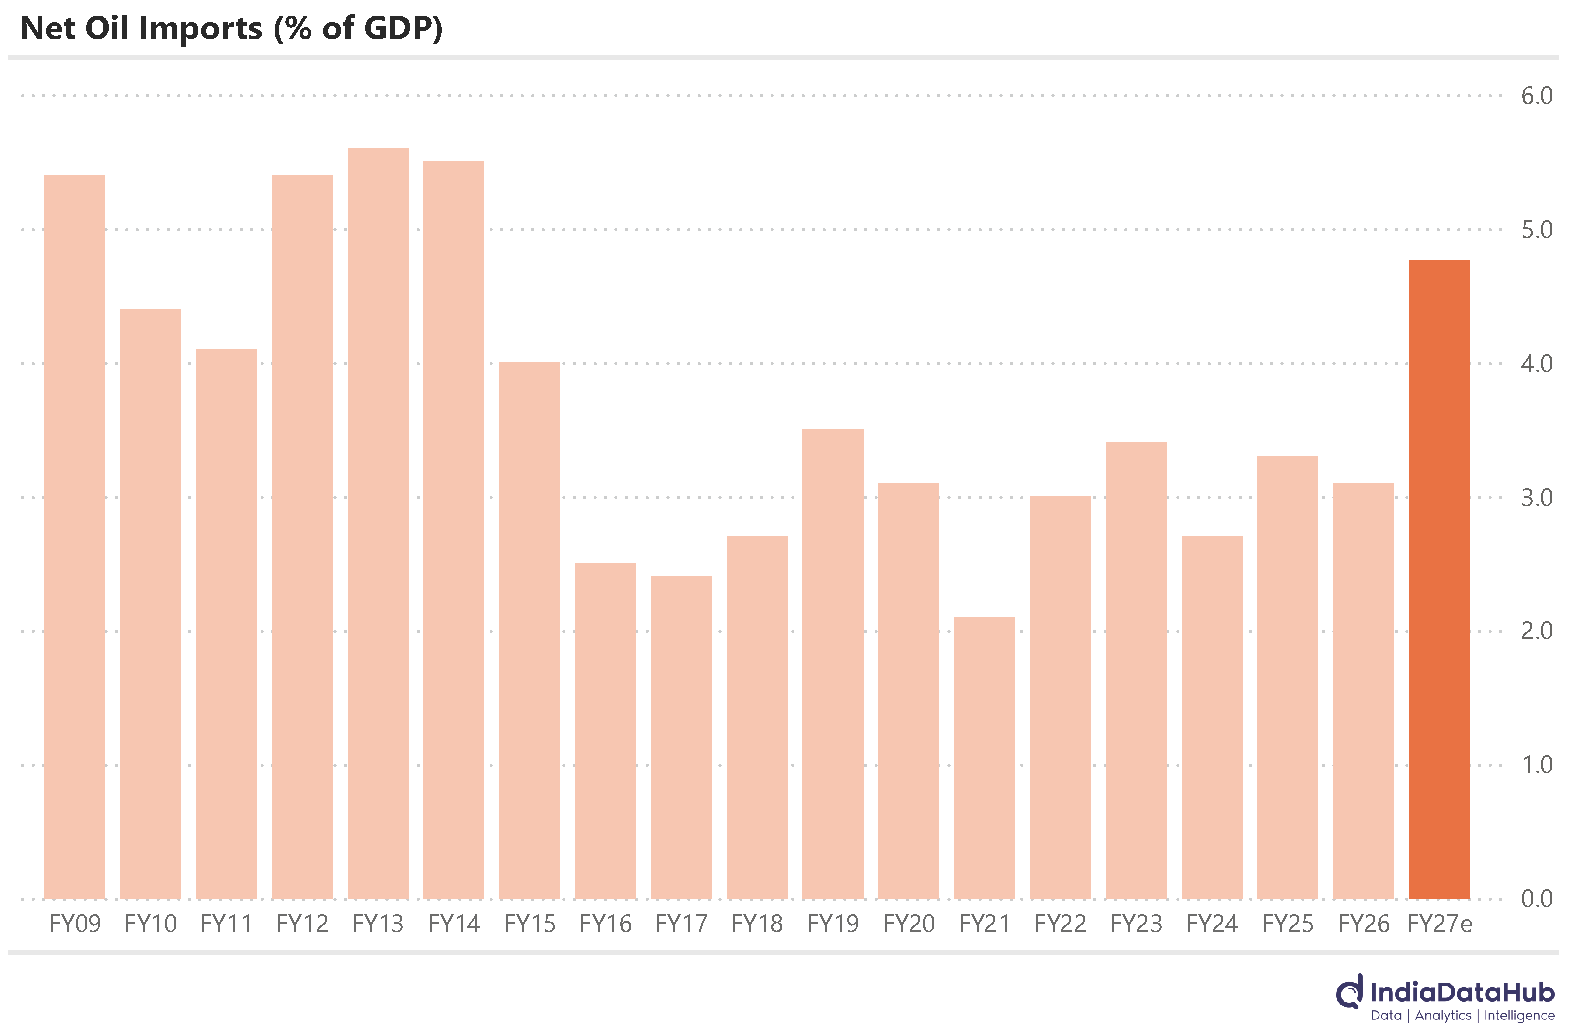
The last time Oil imports were this high, relative to GDP, was during FY12-14, which were not so good years for the economy. So this increase in Oil prices is a major ongoing risk to the economy, irrespective of whether retail fuel prices increase or not.
Lastly, China’s trade. China’s merchandise trade was surprisingly strong in April, with both exports and imports seeing double-digit growth. Exports rose 14.1% year-on-year to $359.4 billion, a significant improvement from the 2.5% growth recorded in March. Imports grew 25.3% year-on-year to $274.6 billion, continuing the trend of double-digit growth seen since January. The stronger growth in imports relative to exports meant that the trade surplus was down on a YoY basis.
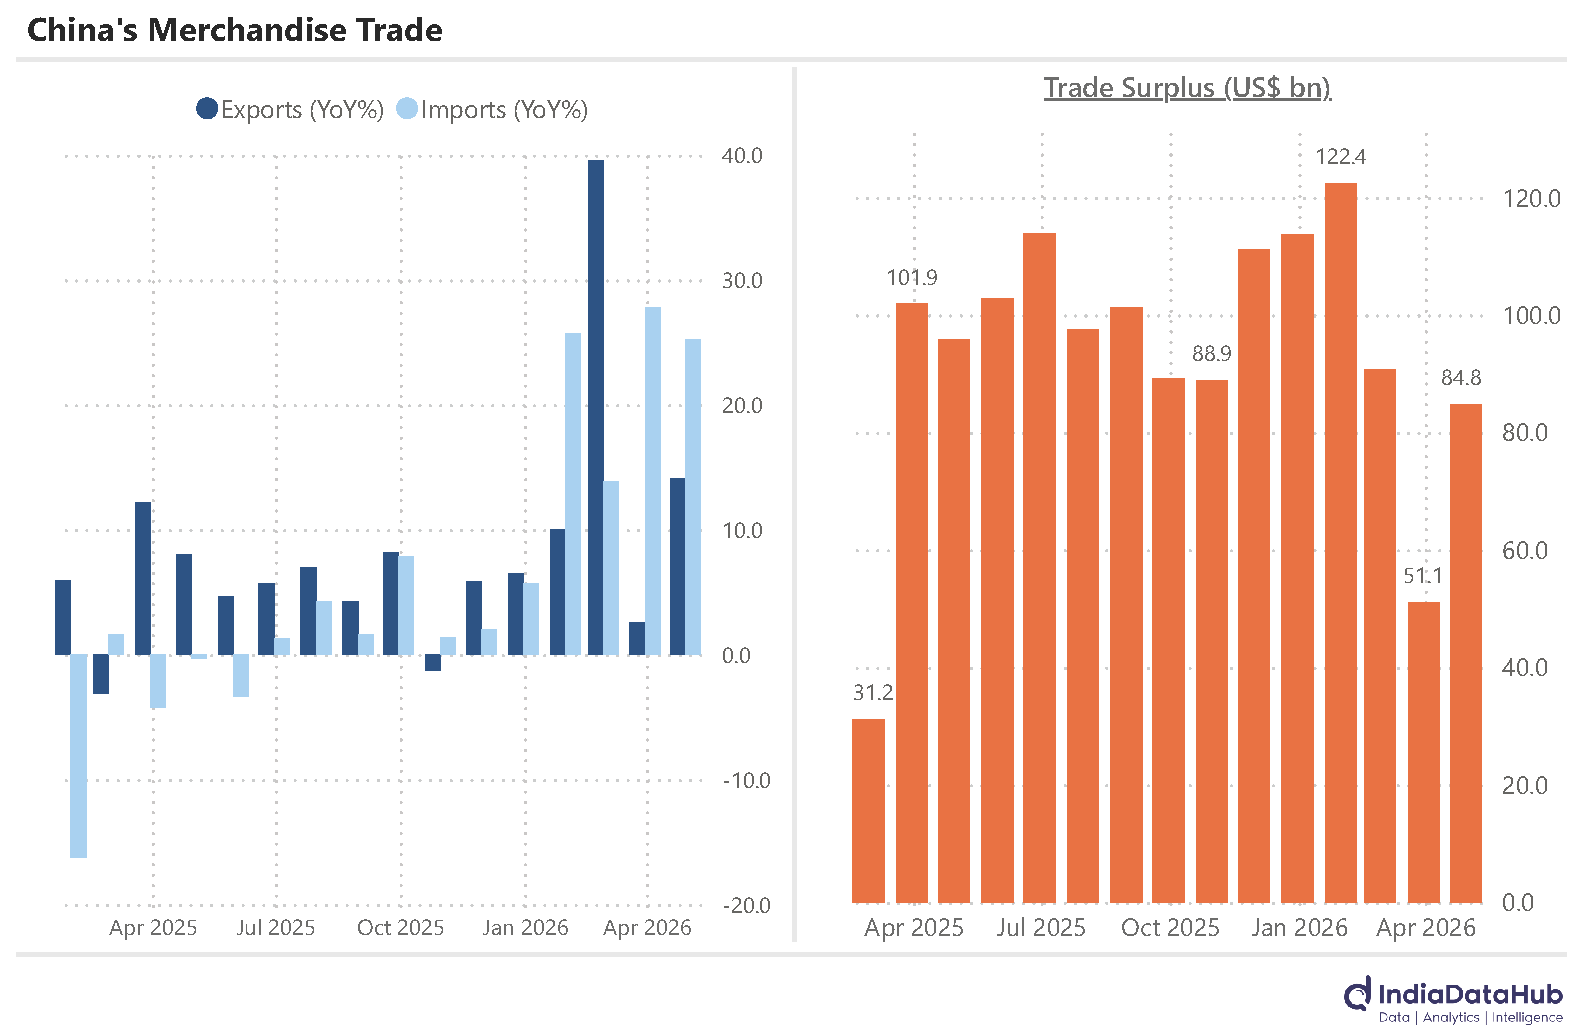
And after 12 months of steady decline, China’s exports to the USA grew in April on a YoY basis. Exports grew 11% YoY, while Imports from China grew 9% YoY, the second consecutive month of growth. Consequently, the trade surplus with the USA widened to US$23bn.
That’s it for this week. See you next week…