
In case you missed, we released a new feature called Custom Series this week. Custom series allows you to build your own series by combining any series using any of BODMAS operators and save it for later use. You can create the series on the web or our excel plugin and access it from anywhere. This video gives you a quick demo…In this edition of This Week In Data, we discuss:
CPI Inflation rose slightly in August. But it does not matter.
Mutual funds had another strong month of inflows
Mutual fund ownership of markets has crossed 10%, with significant sectoral variations
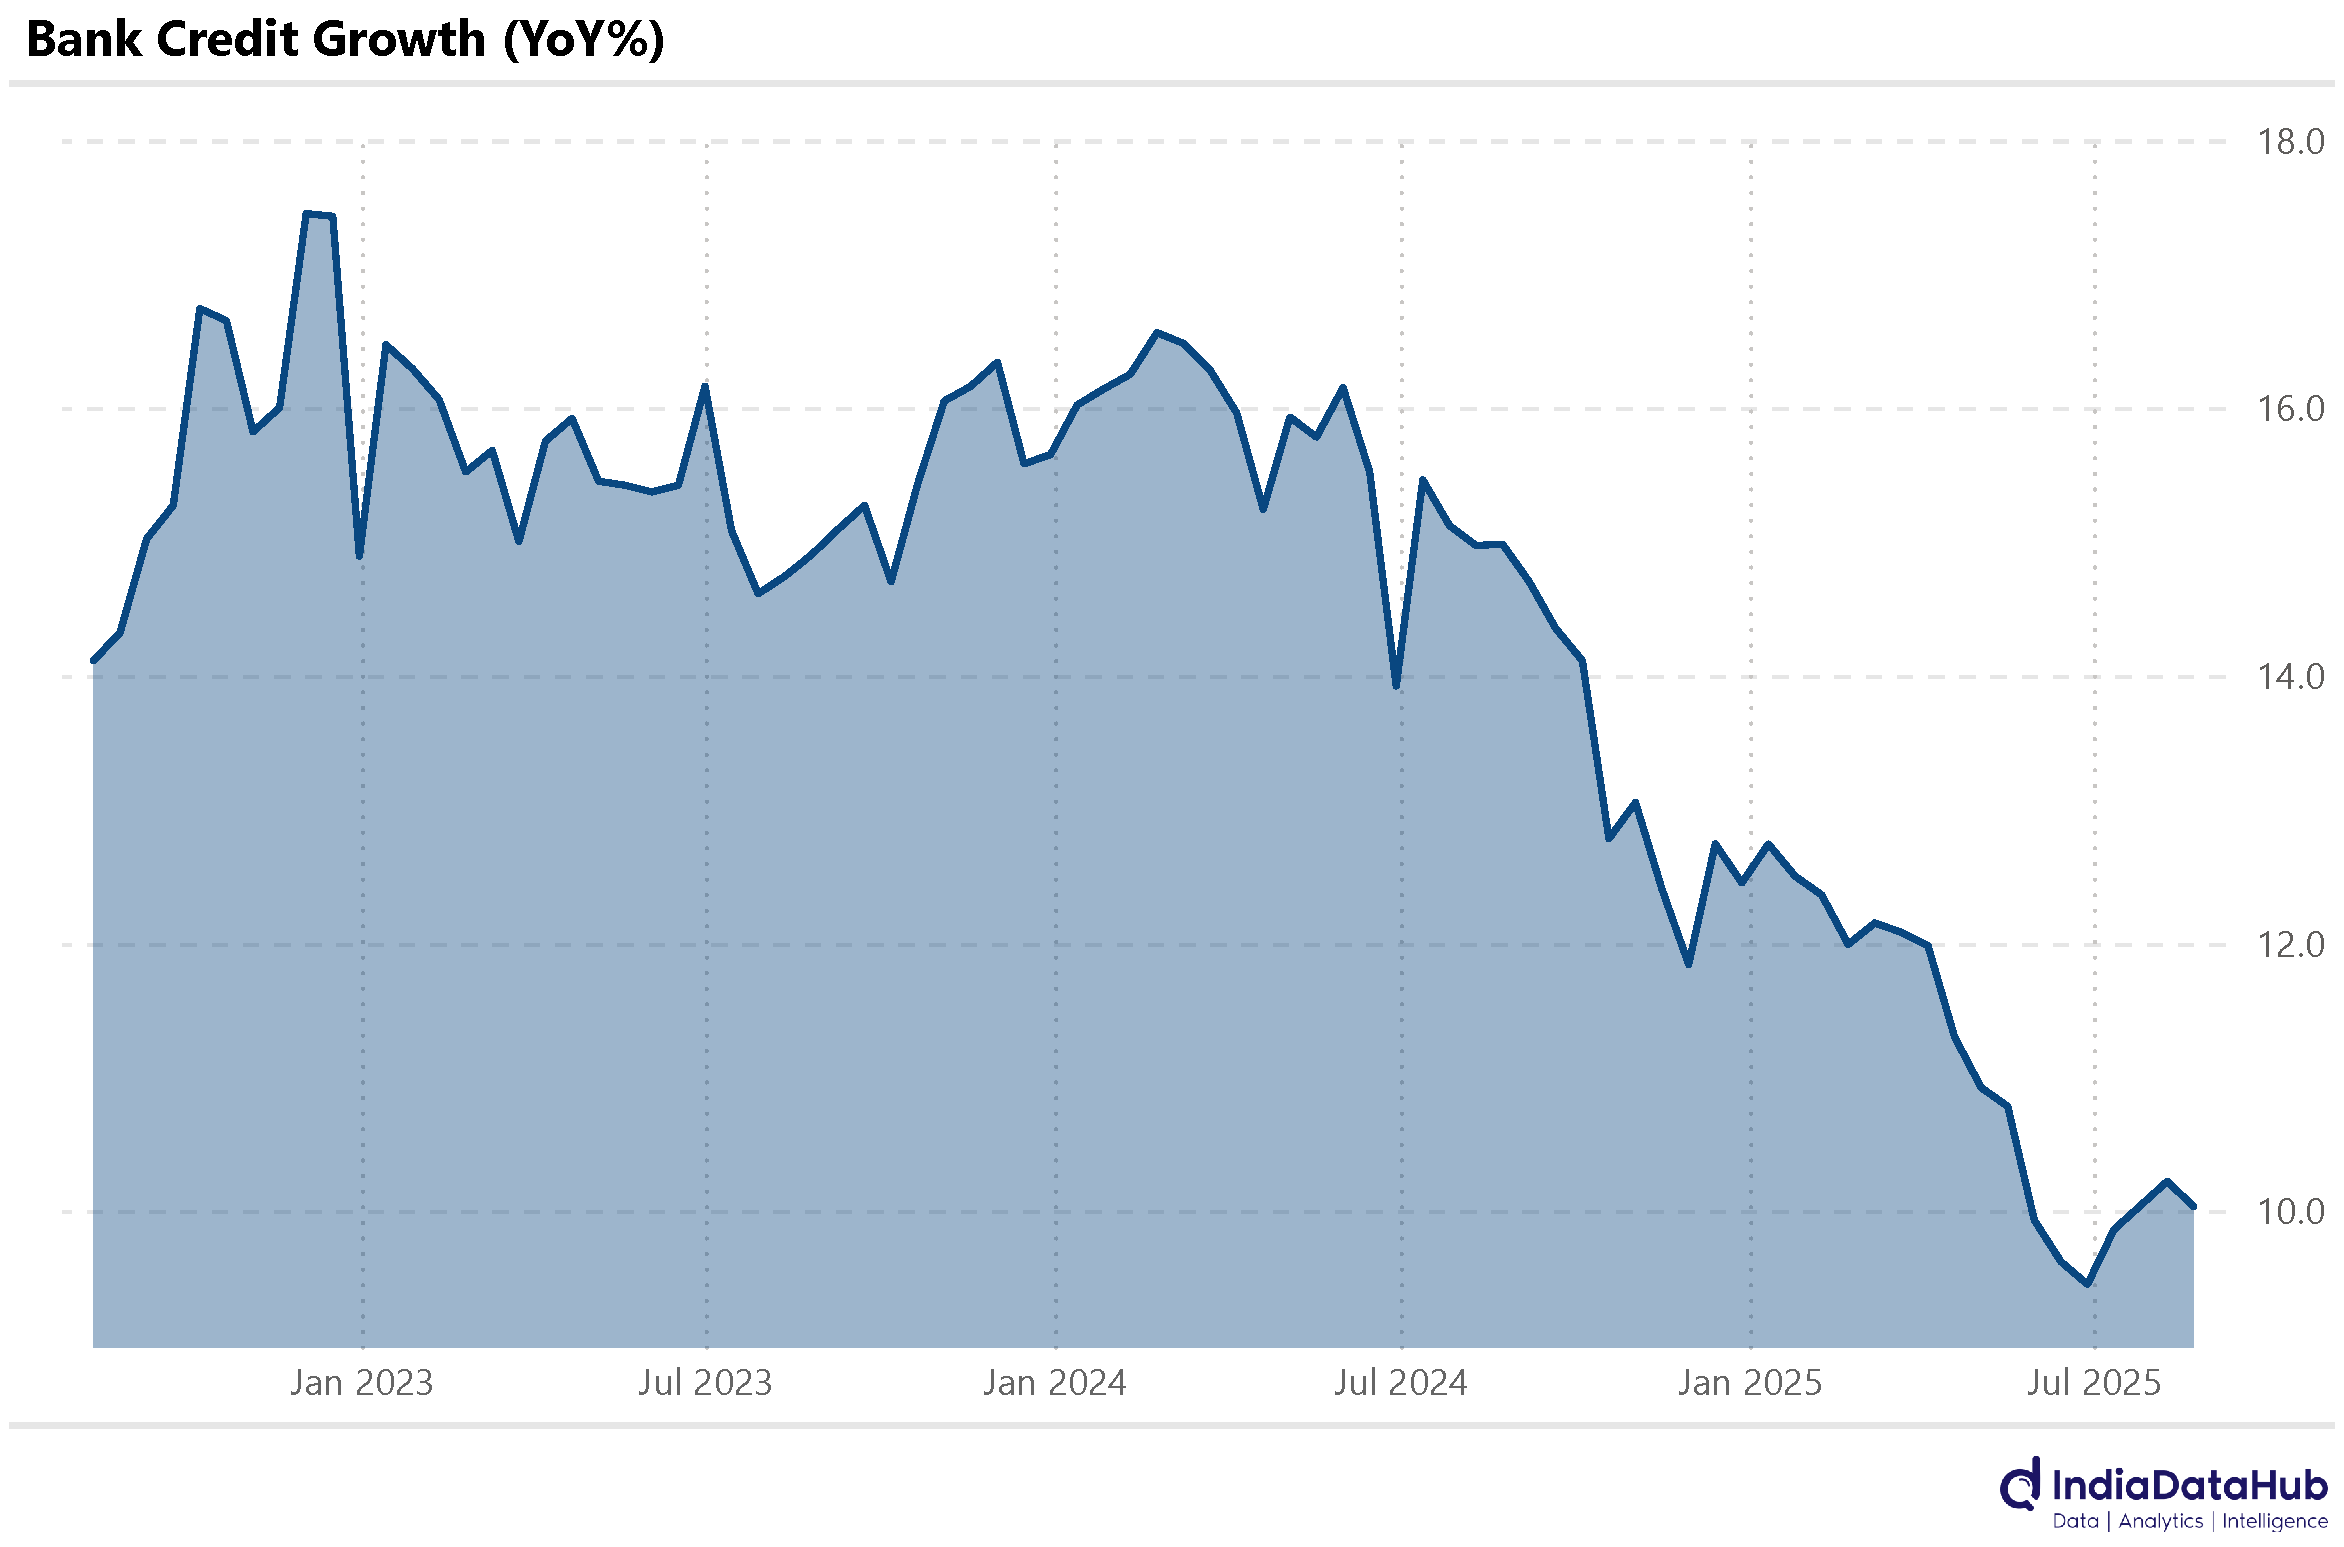
Bank credit growth has stabilised at ~10% after having decelerated sharply through most of FY25
Despite slowdown, credit growth is outpacing GDP growth
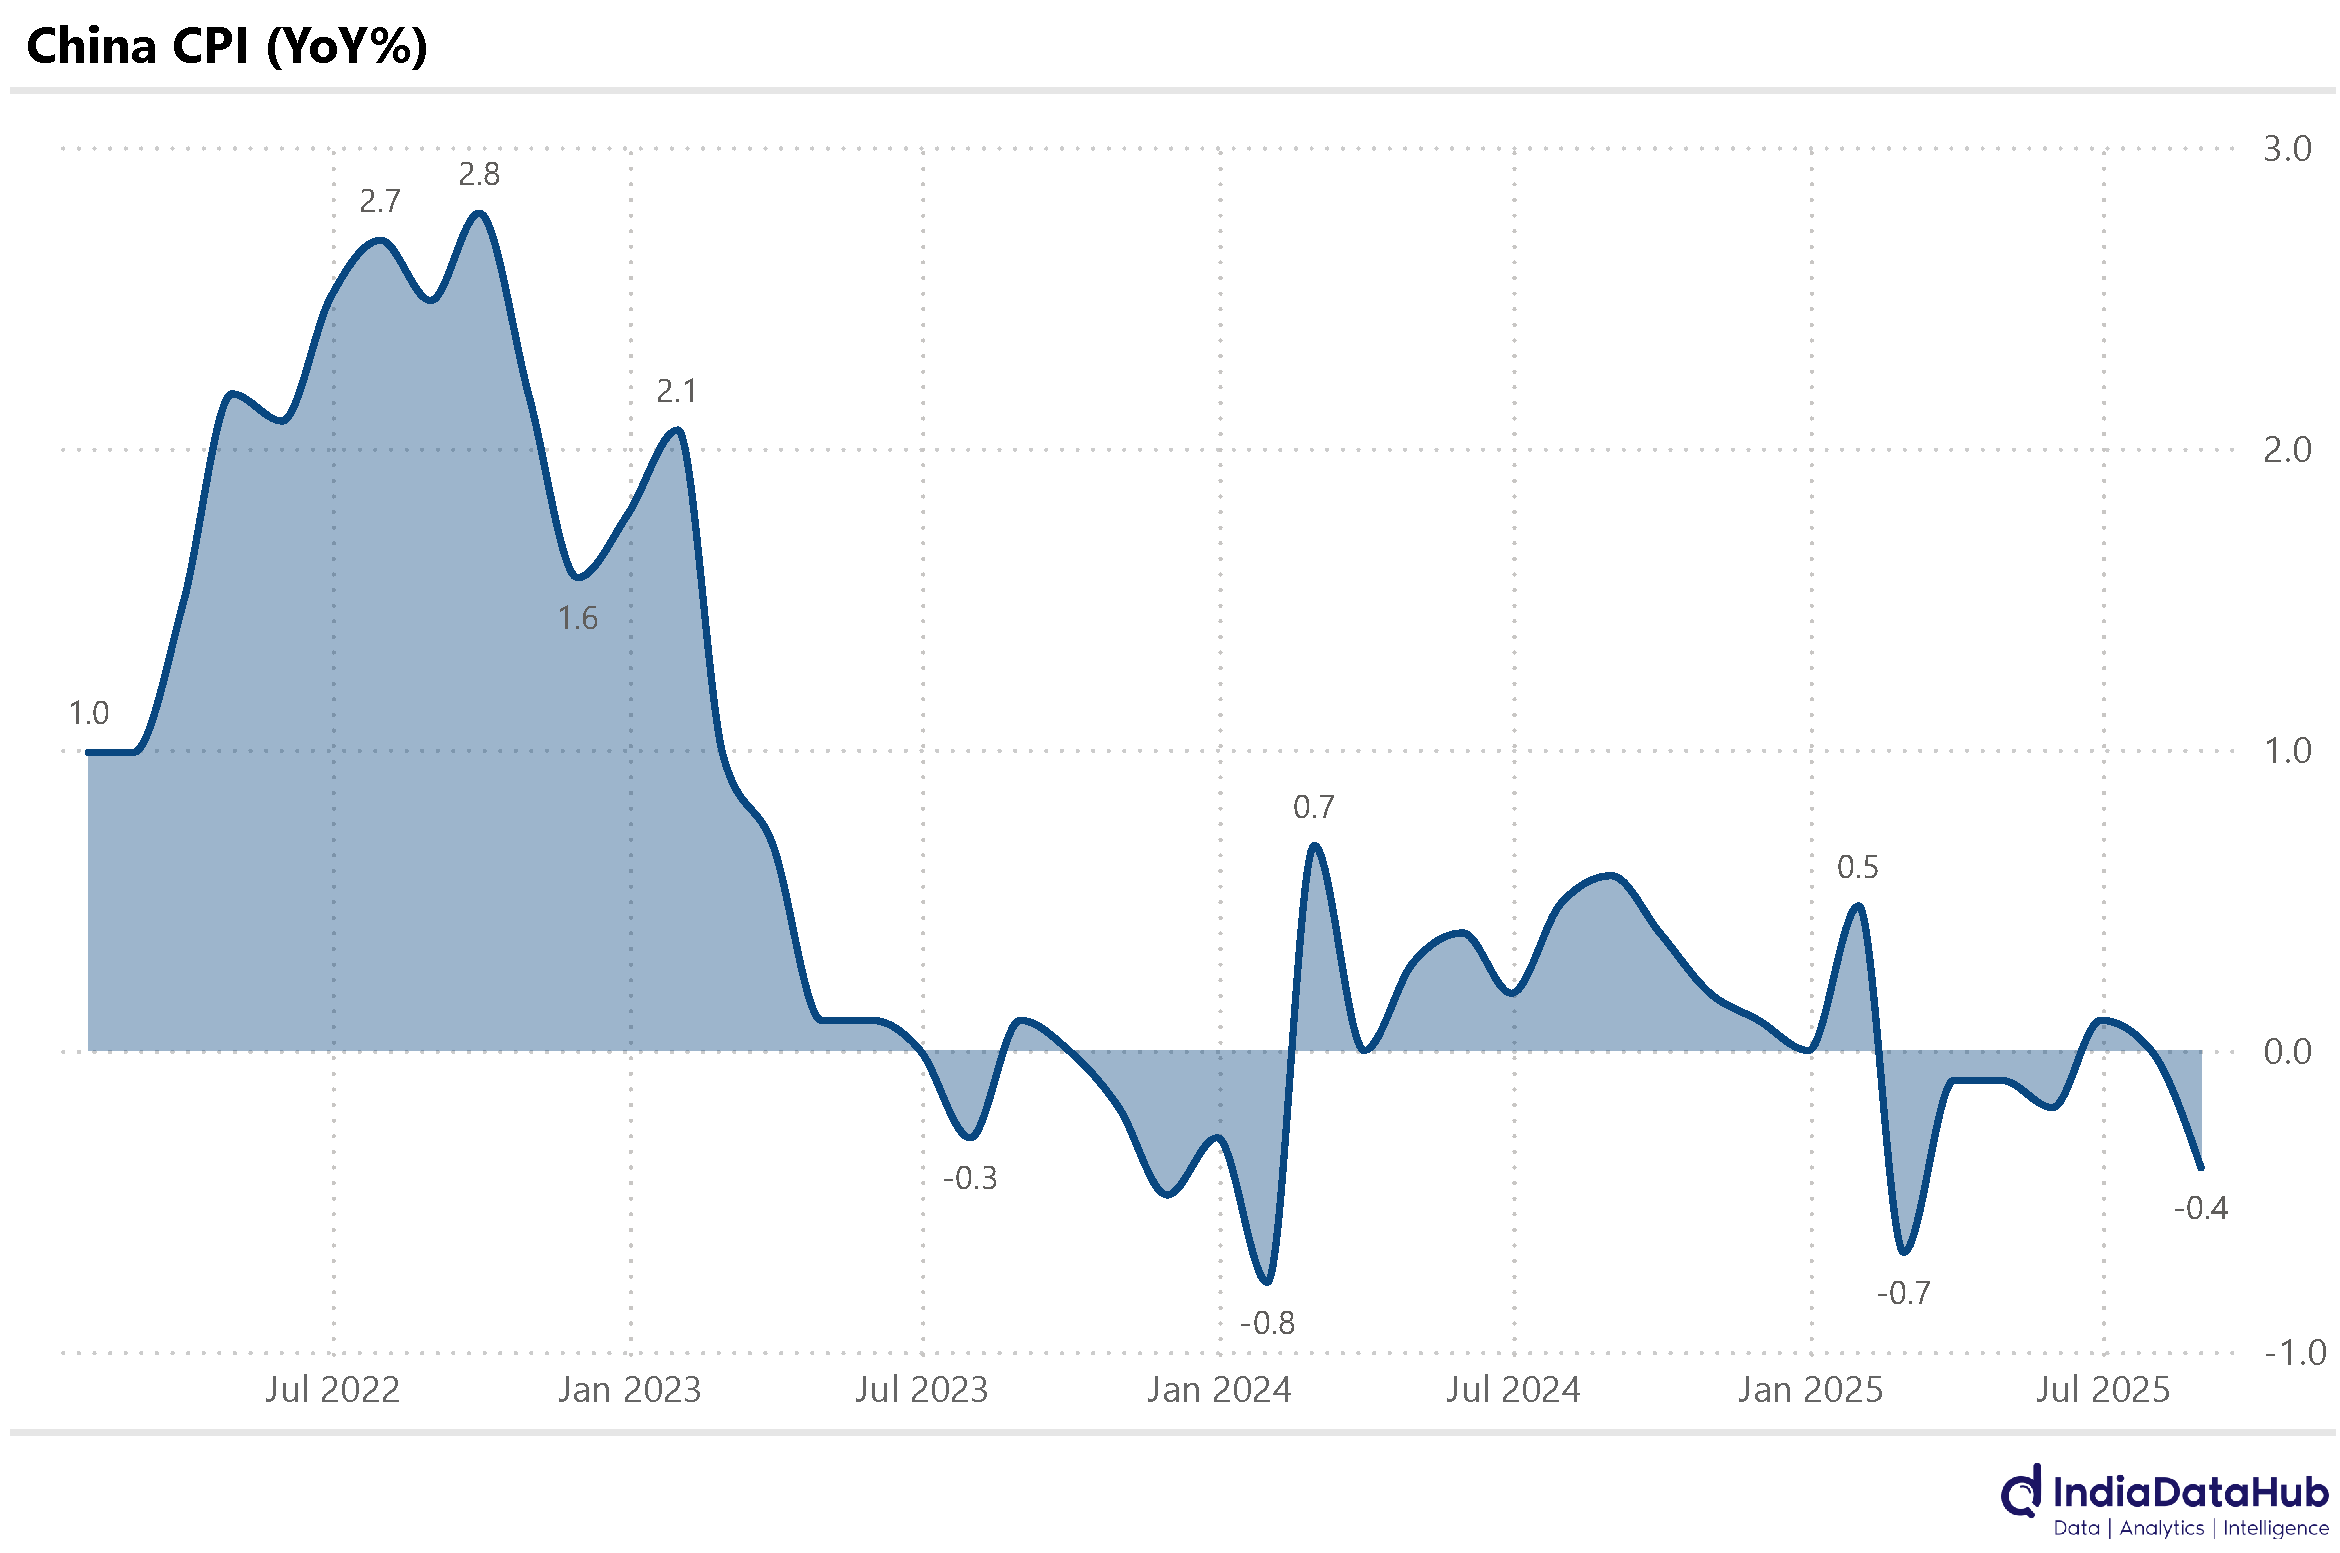
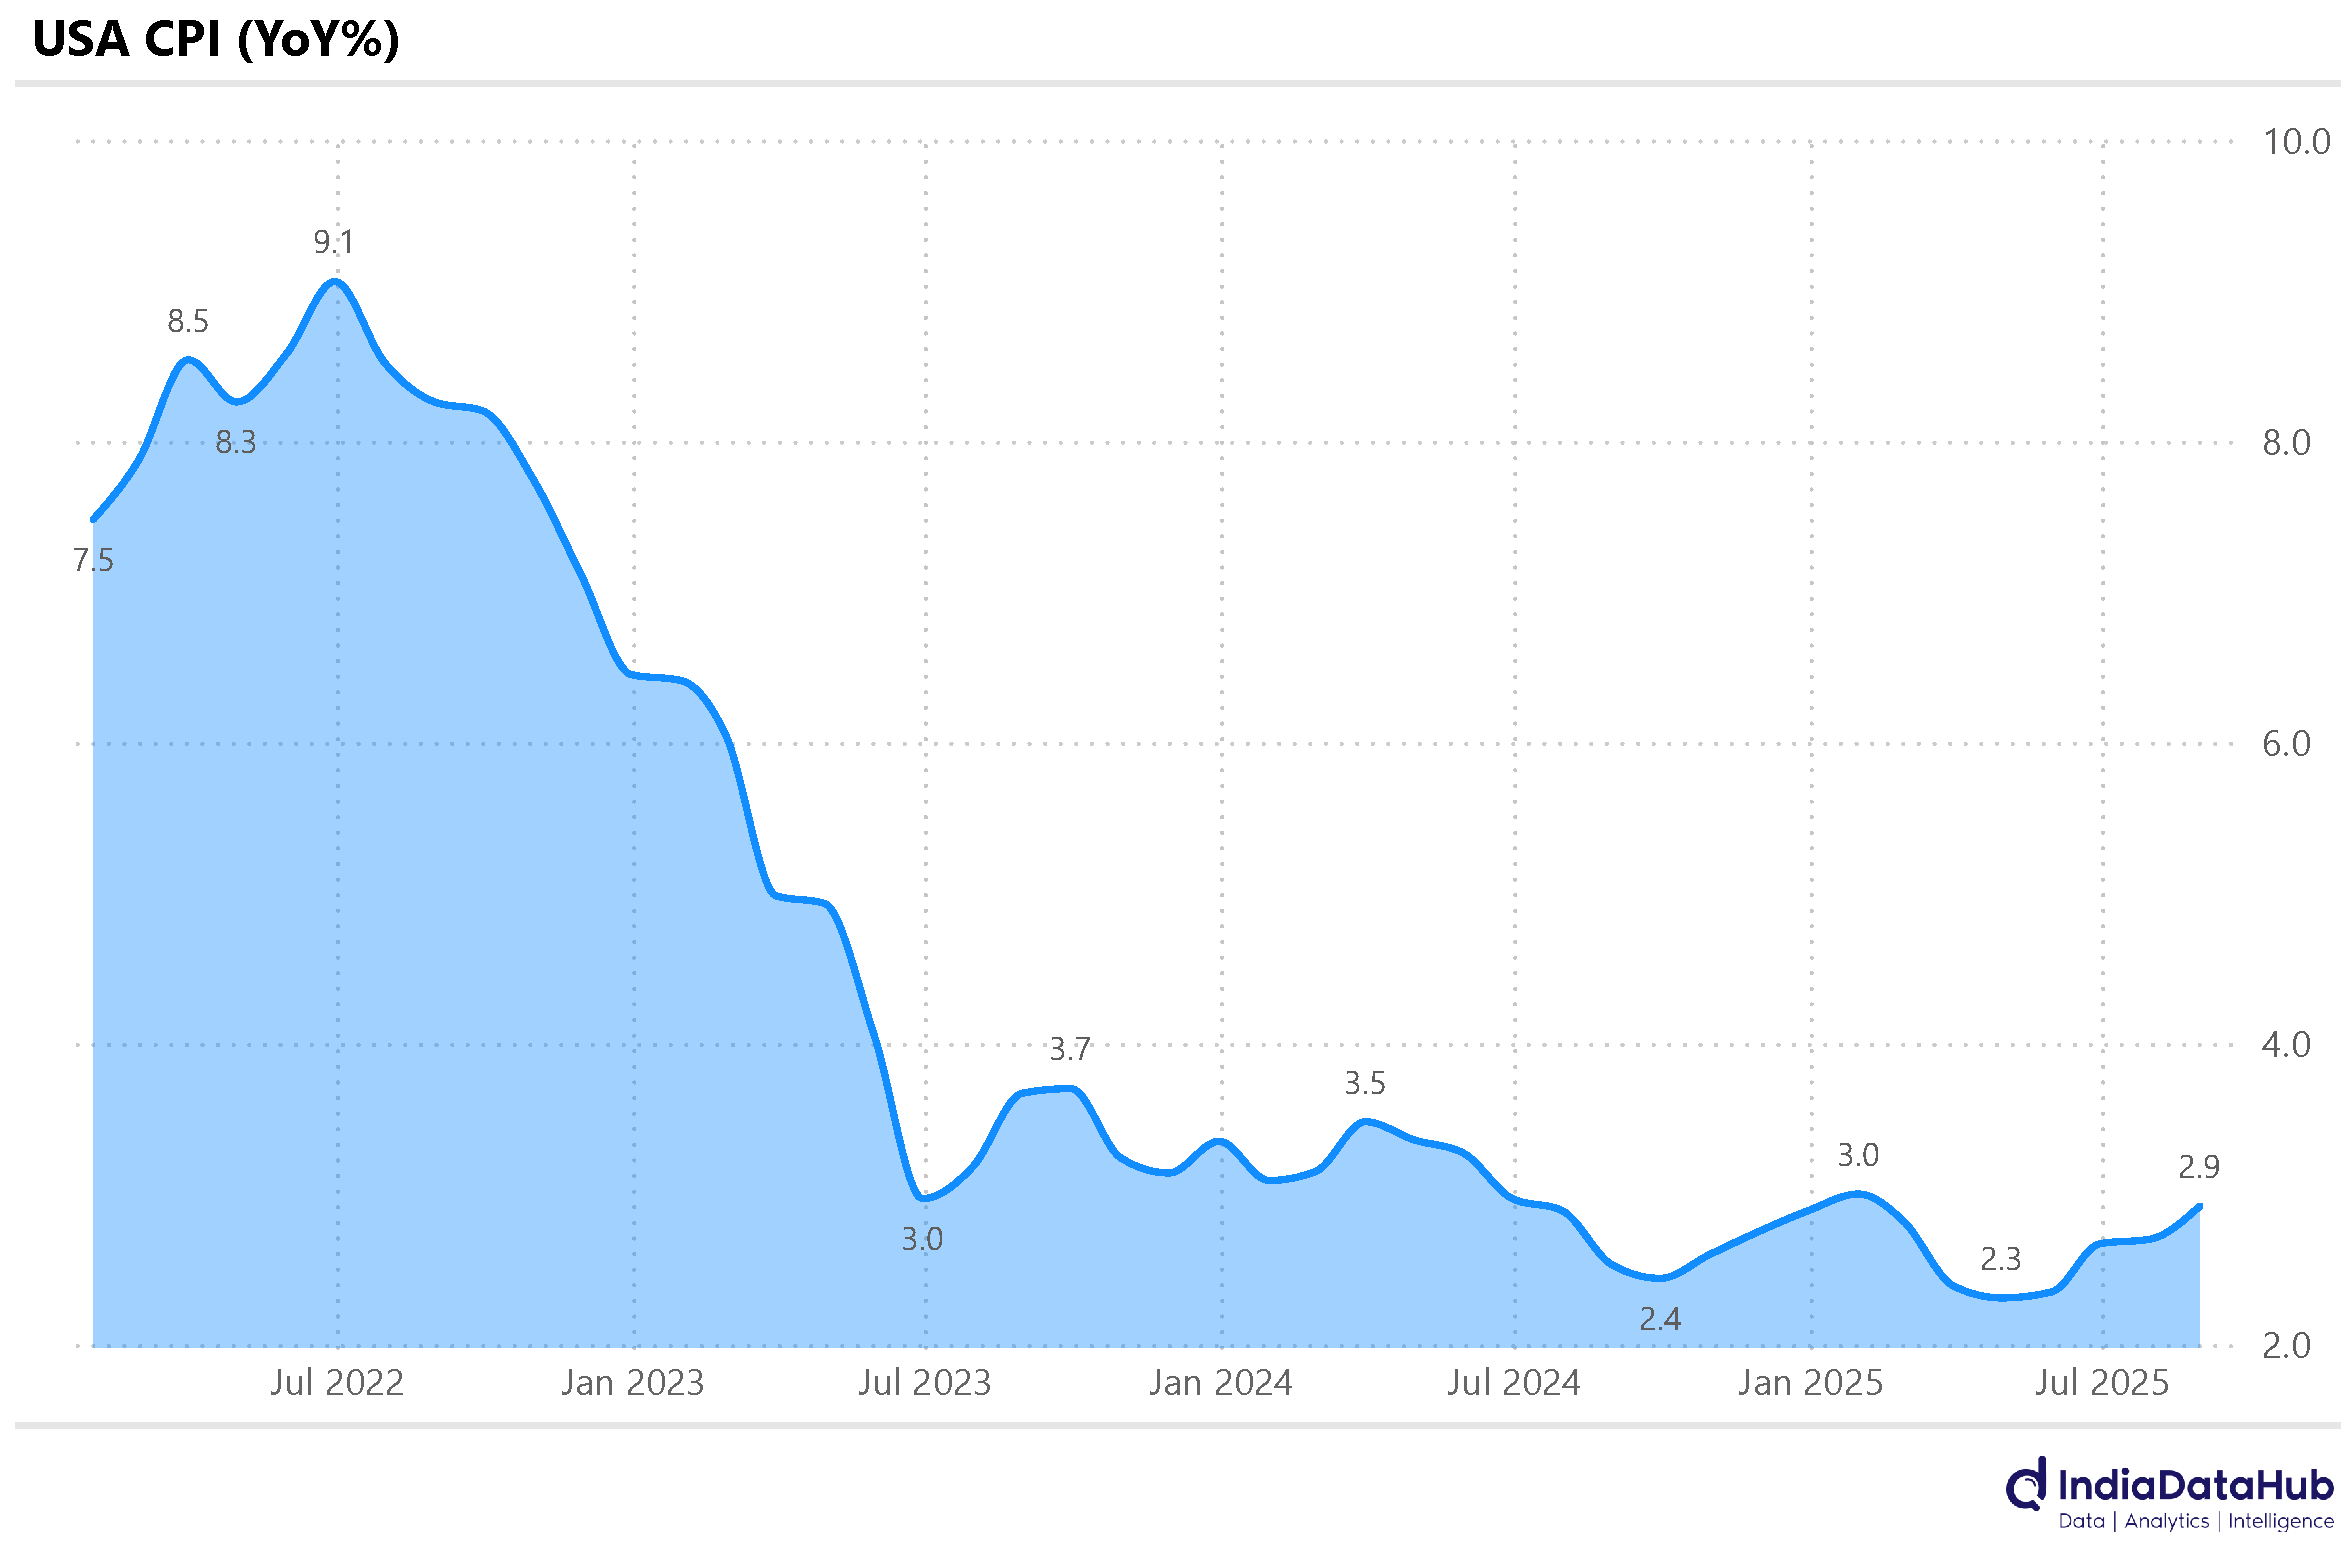
China sees another month of deflation but inflation rises in the USA
ECB keeps policy rates unchanged but Turkey and Russia cut interest rates
CPI Inflation ticked up from 1.6% in July to 2.1% in August. The uptick was entirely due to an increase in food inflation. CPI excluding Food and Beverages actually ticked down by 4bps to 3.91%. And the core-core CPI (which excludes Food & Beverages, Fuel, Precious Metals, and Retail Fuels) ticked down by ~15bps to 3.1% and is now the lowest since June last year. And the recently announced GST rate changes will also likely have some salutary impact on inflation.
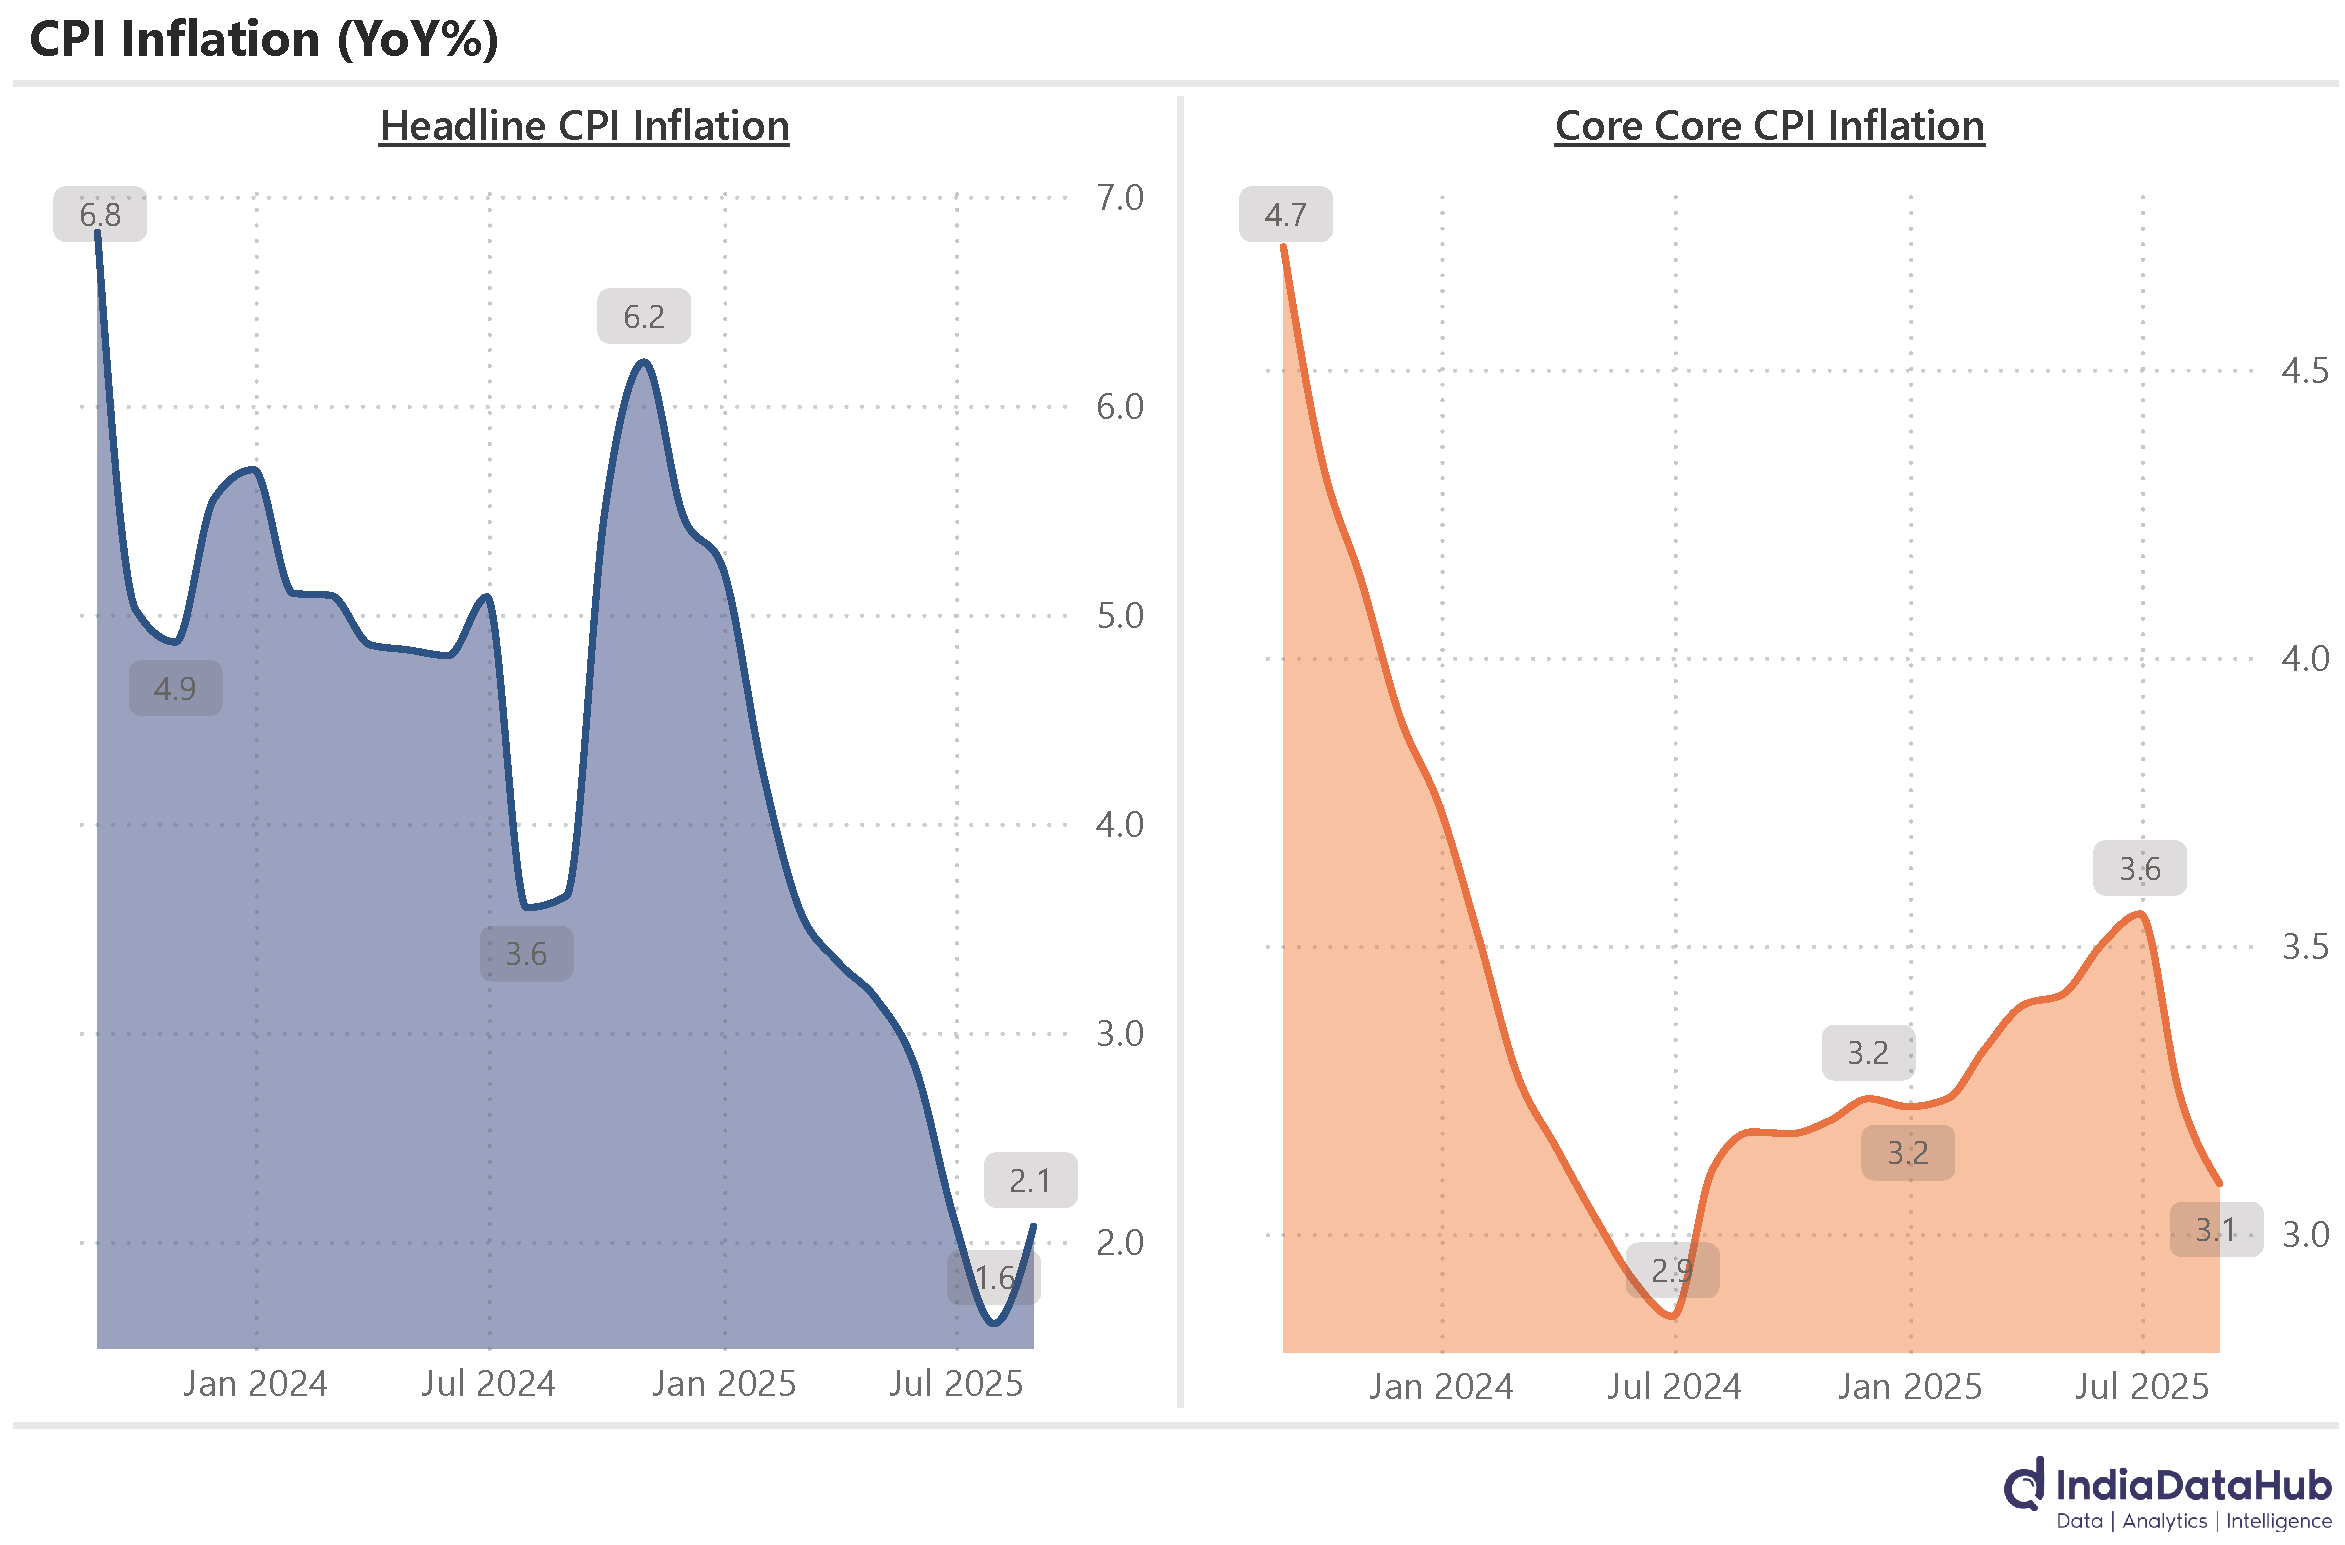
So, all remains by and large quiet on the inflation front, for now. The unusually low levels of food inflation will mean revert and that will push up headline inflation towards 3-4% in the next few months. But this is already in the forecasts for everyone, and so this will not be a surprise. Furthermore, the interest rate cycle is now less contingent on rates and more contingent on growth. Rate cuts from the RBI are subject to slower growth than anticipated, rather than lower inflation than anticipated. So, from a policy perspective, the near-term trajectory of inflation has very little signal value.
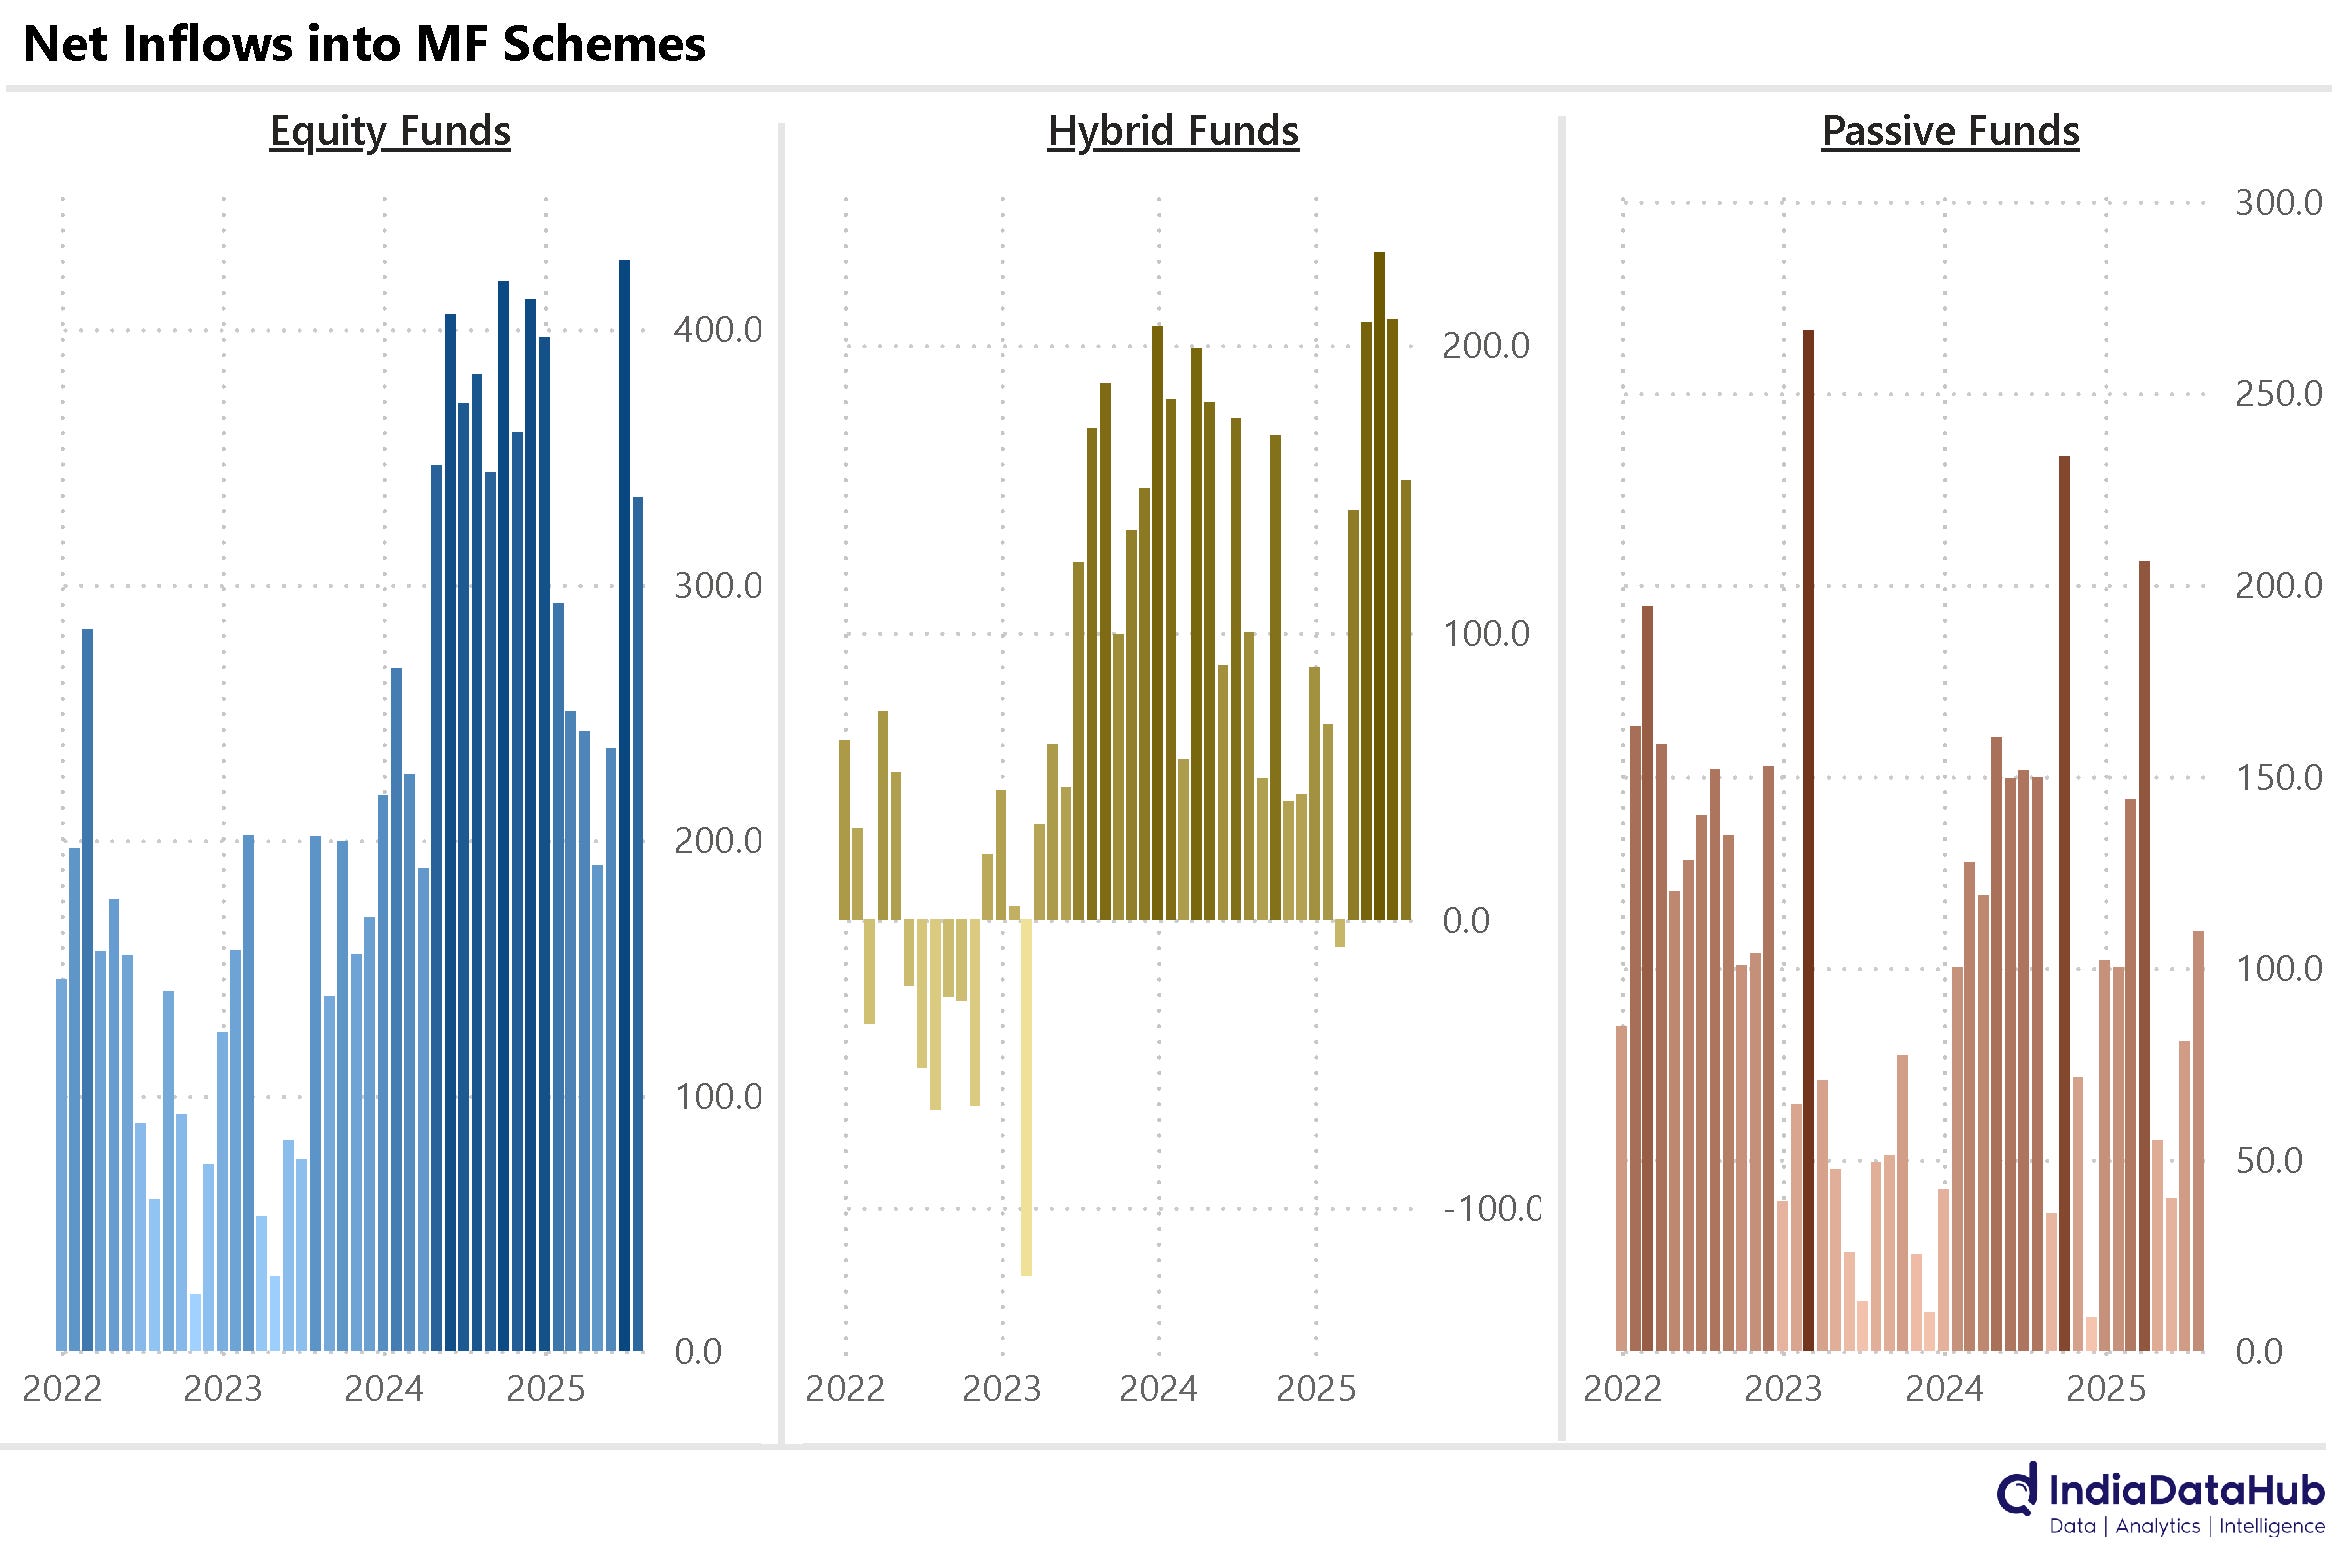
August was another strong month for domestic equity flows. Mutual funds took in over ₹300bn of net flows into equity funds, the second-highest monthly flows since January this year. More importantly, equity funds have seen consistent net inflows in every single month for almost 5 years. Hybrid funds also saw strong inflows (~₹150bn), and passive funds also saw 4-month high inflows of just over ₹100bn.
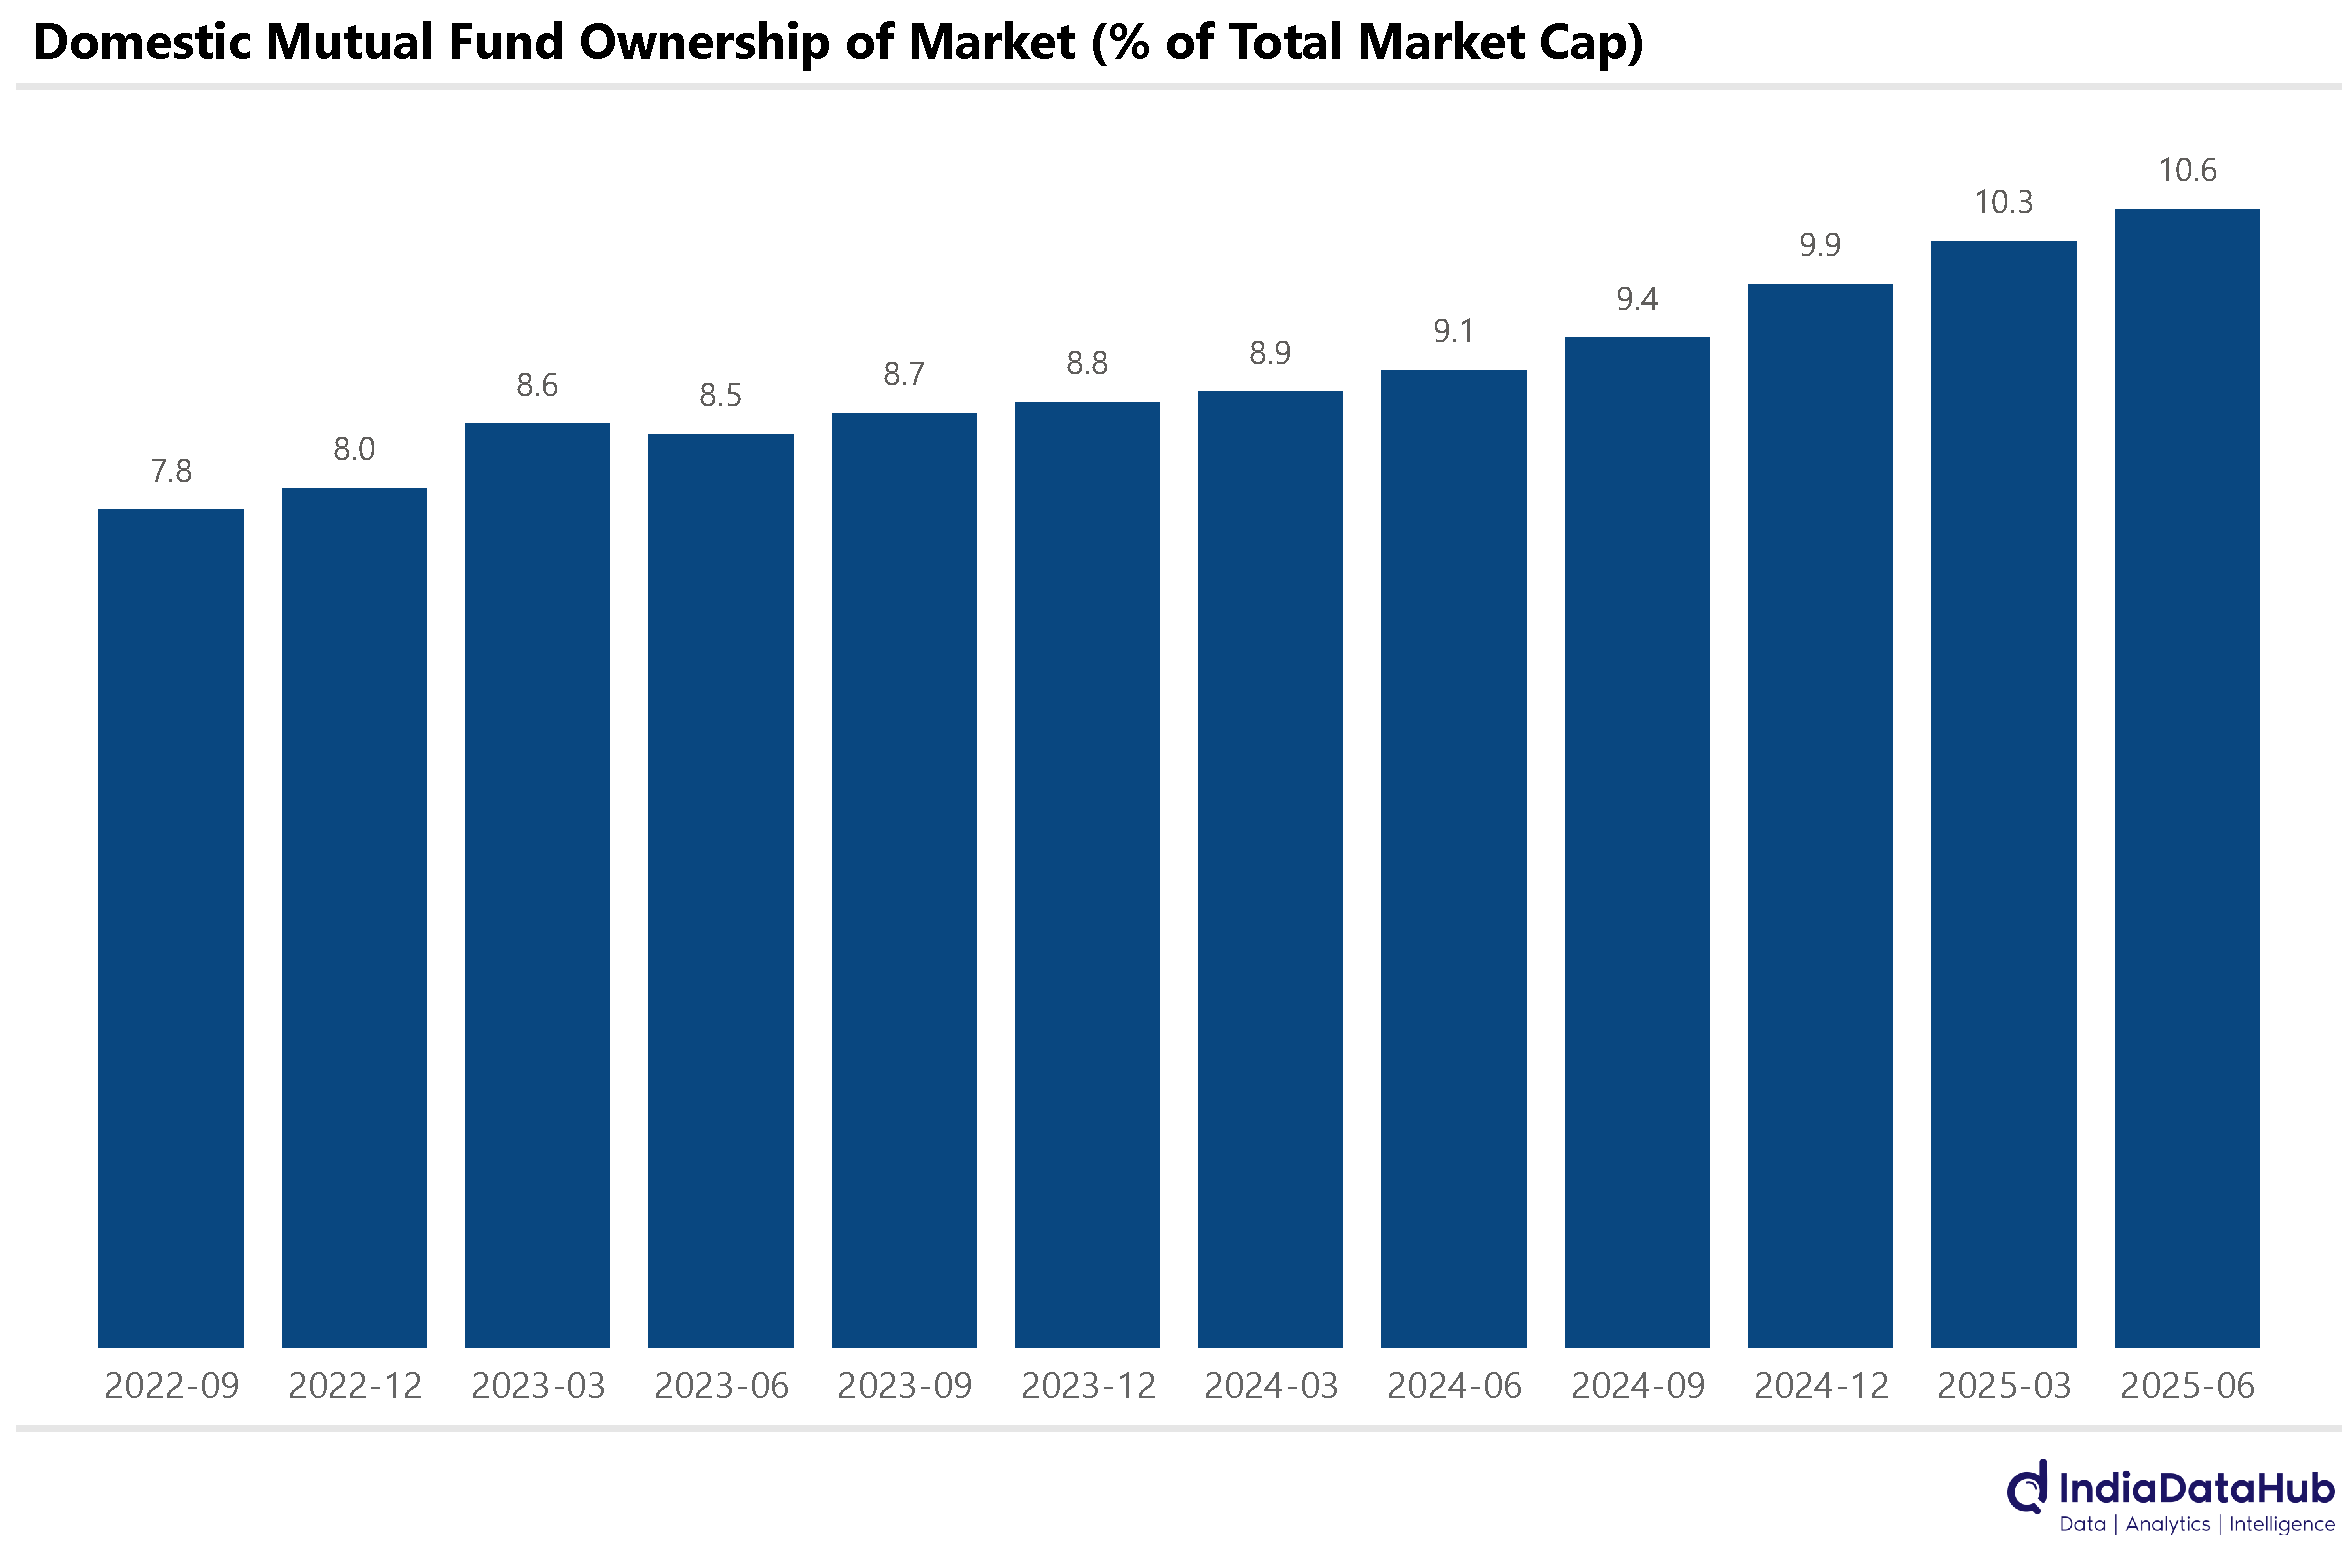
And these consistent inflows reflect in higher MF ownership of the market. As of June this year, domestic mutual funds owned 10.6% of the market, the highest ever. Indeed, in just the last 2 years, the mutual fund ownership of the market has increased by over 2ppt and almost 3ppt in the past 3 years. And along with Insurance companies, whose holding of the market has remained by and large unchanged, domestic institutions own over 17% of the market, again the highest ever.
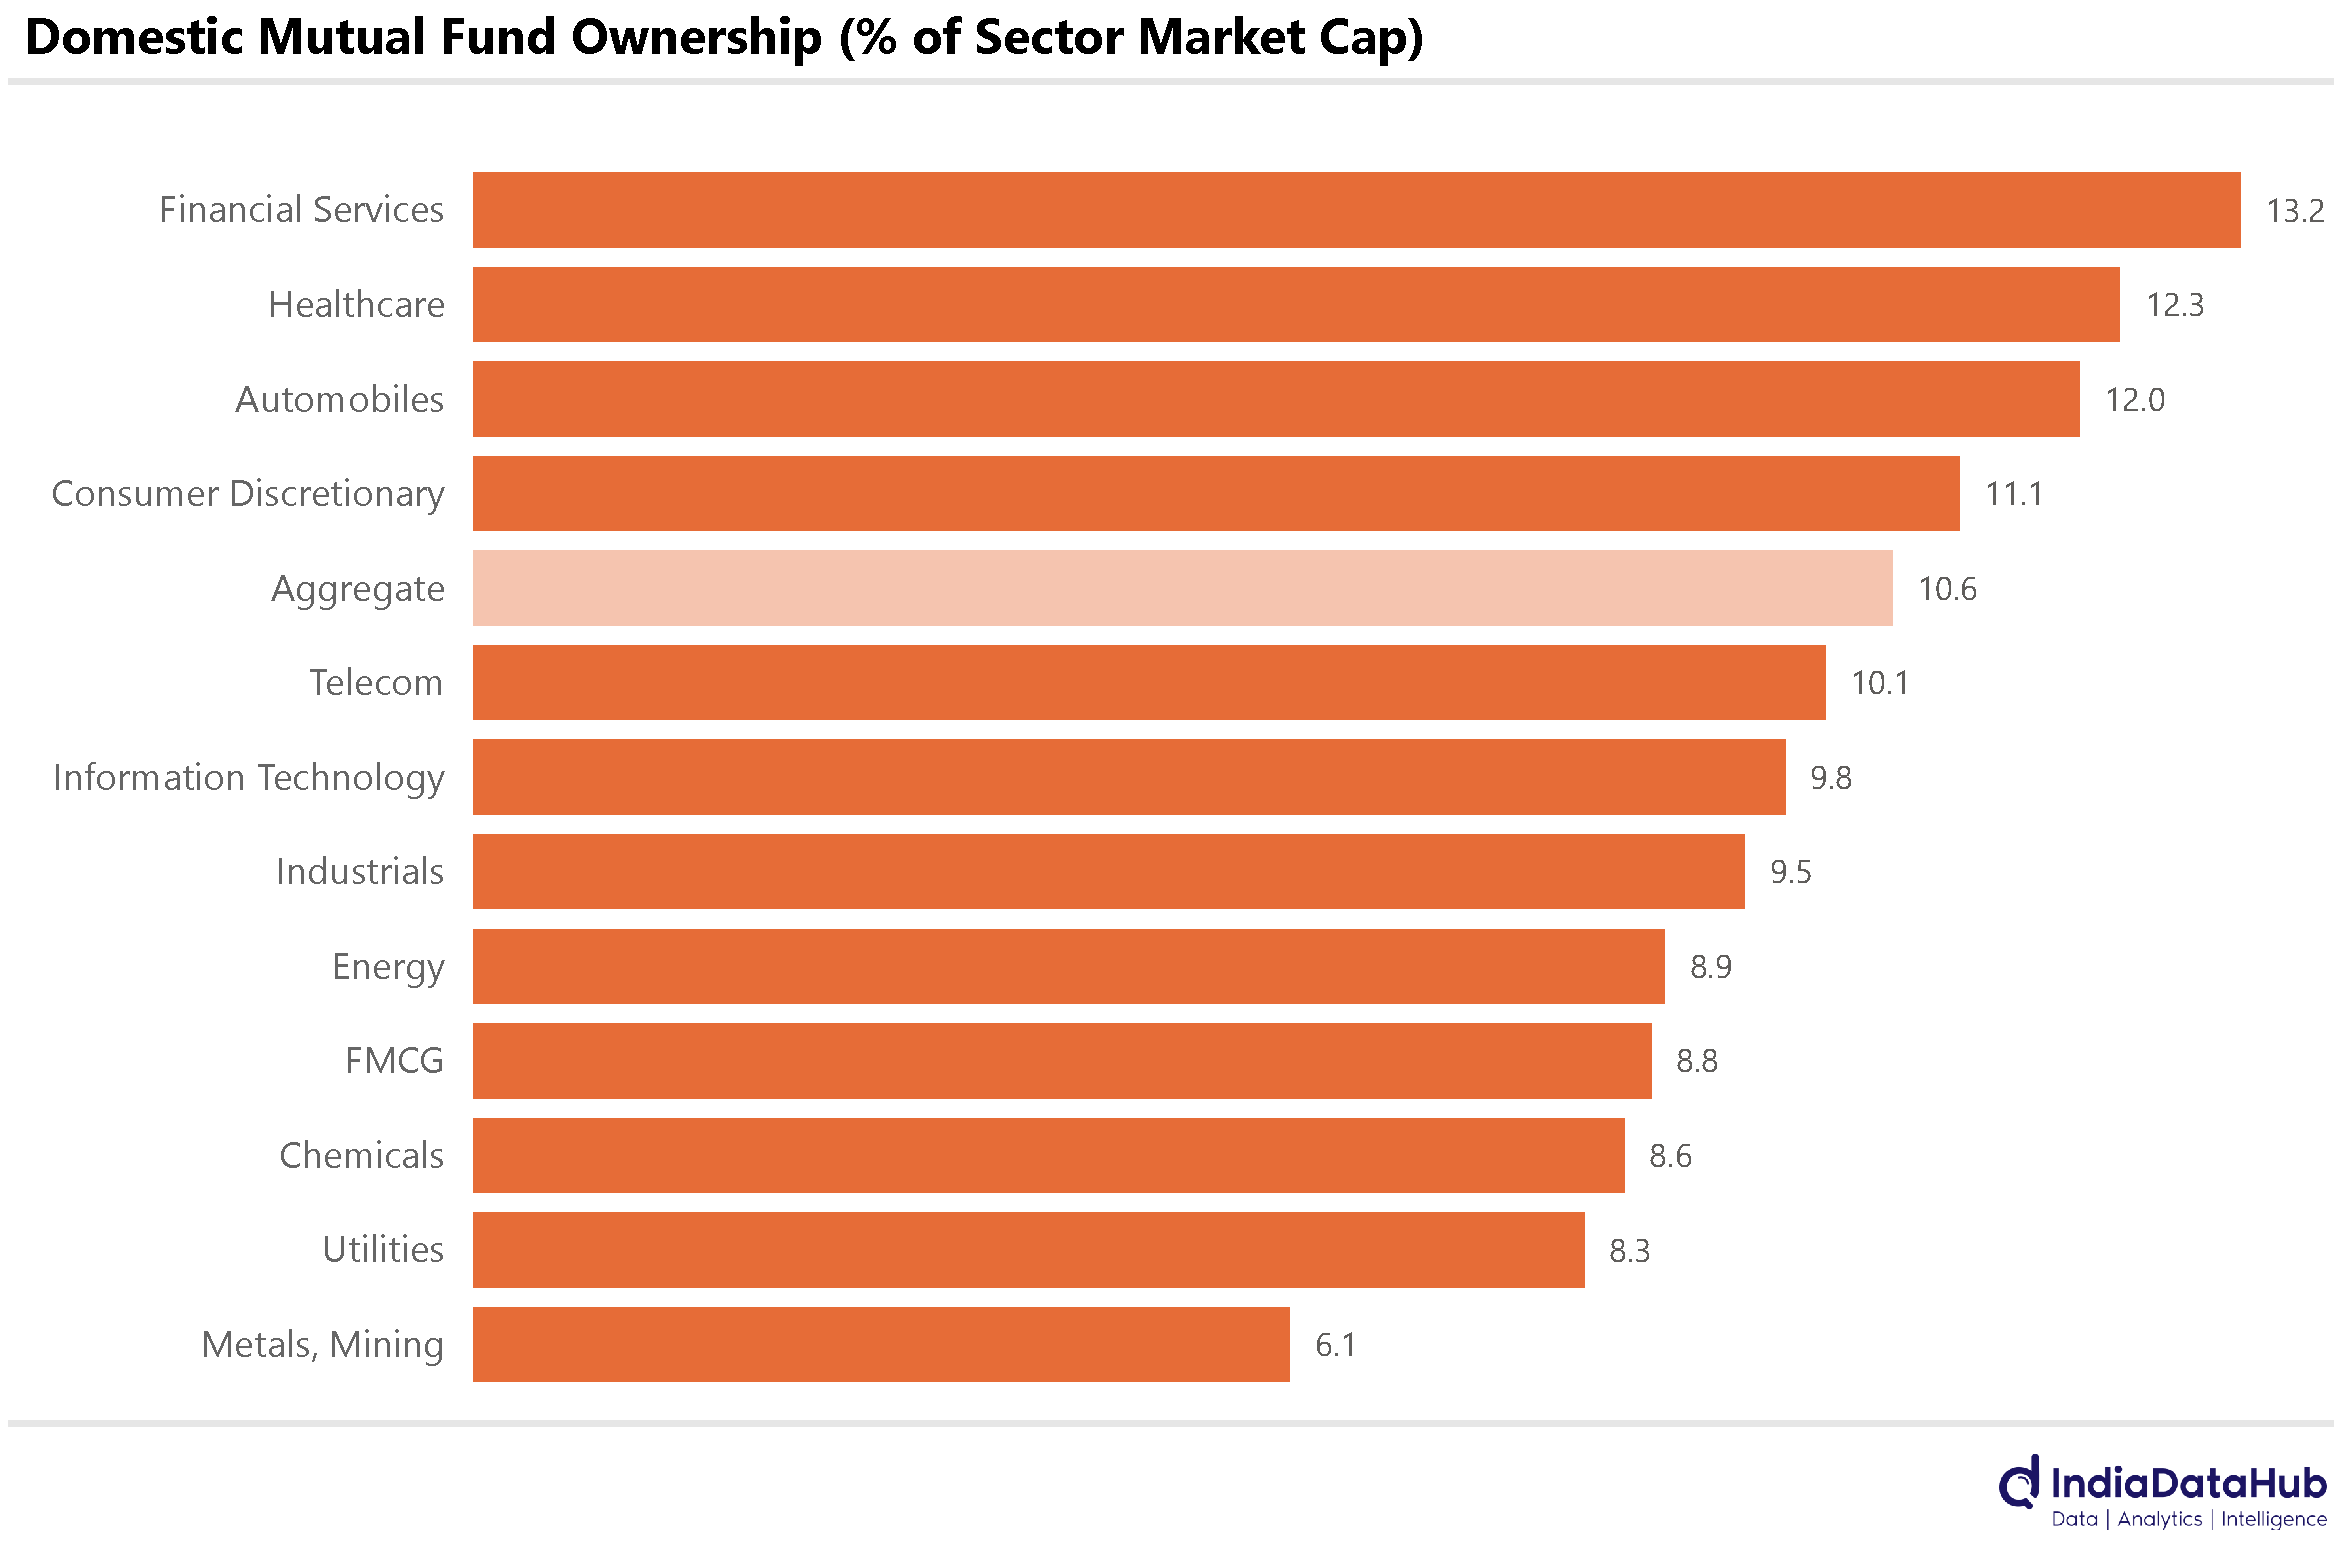
Sectorally, mutual funds have the highest shareholding in Financial Services, Healthcare, and Automobiles. They own ~12-13% of each of these sectors. Their lowest shareholding is in Metals and Mining, where they collectively own just 6% of the sector.
Bank credit growth has continued to remain stable at ~10% for the last few months now, after having decelerated from 16% in March last year to 10% in May this year. But the interesting thing is that a large part of this slowdown was due to moderation in nominal GDP growth.
Consequently, despite this slowdown in credit growth, bank credit grew faster than nominal GDP growth, and thus, the bank credit to GDP ratio or the credit intensity of the economy increased in FY25. After reaching 50% at the end of FY09, the bank credit to GDP ratio had stagnated at 50-55% for almost 15 years (excluding FY21 when it rose sharply as nominal GDP declined due to the COVID-19 pandemic). As of March 2025, Bank credit stood at 55.2% of GDP, 60bps higher than in March 2024 and the highest ever!
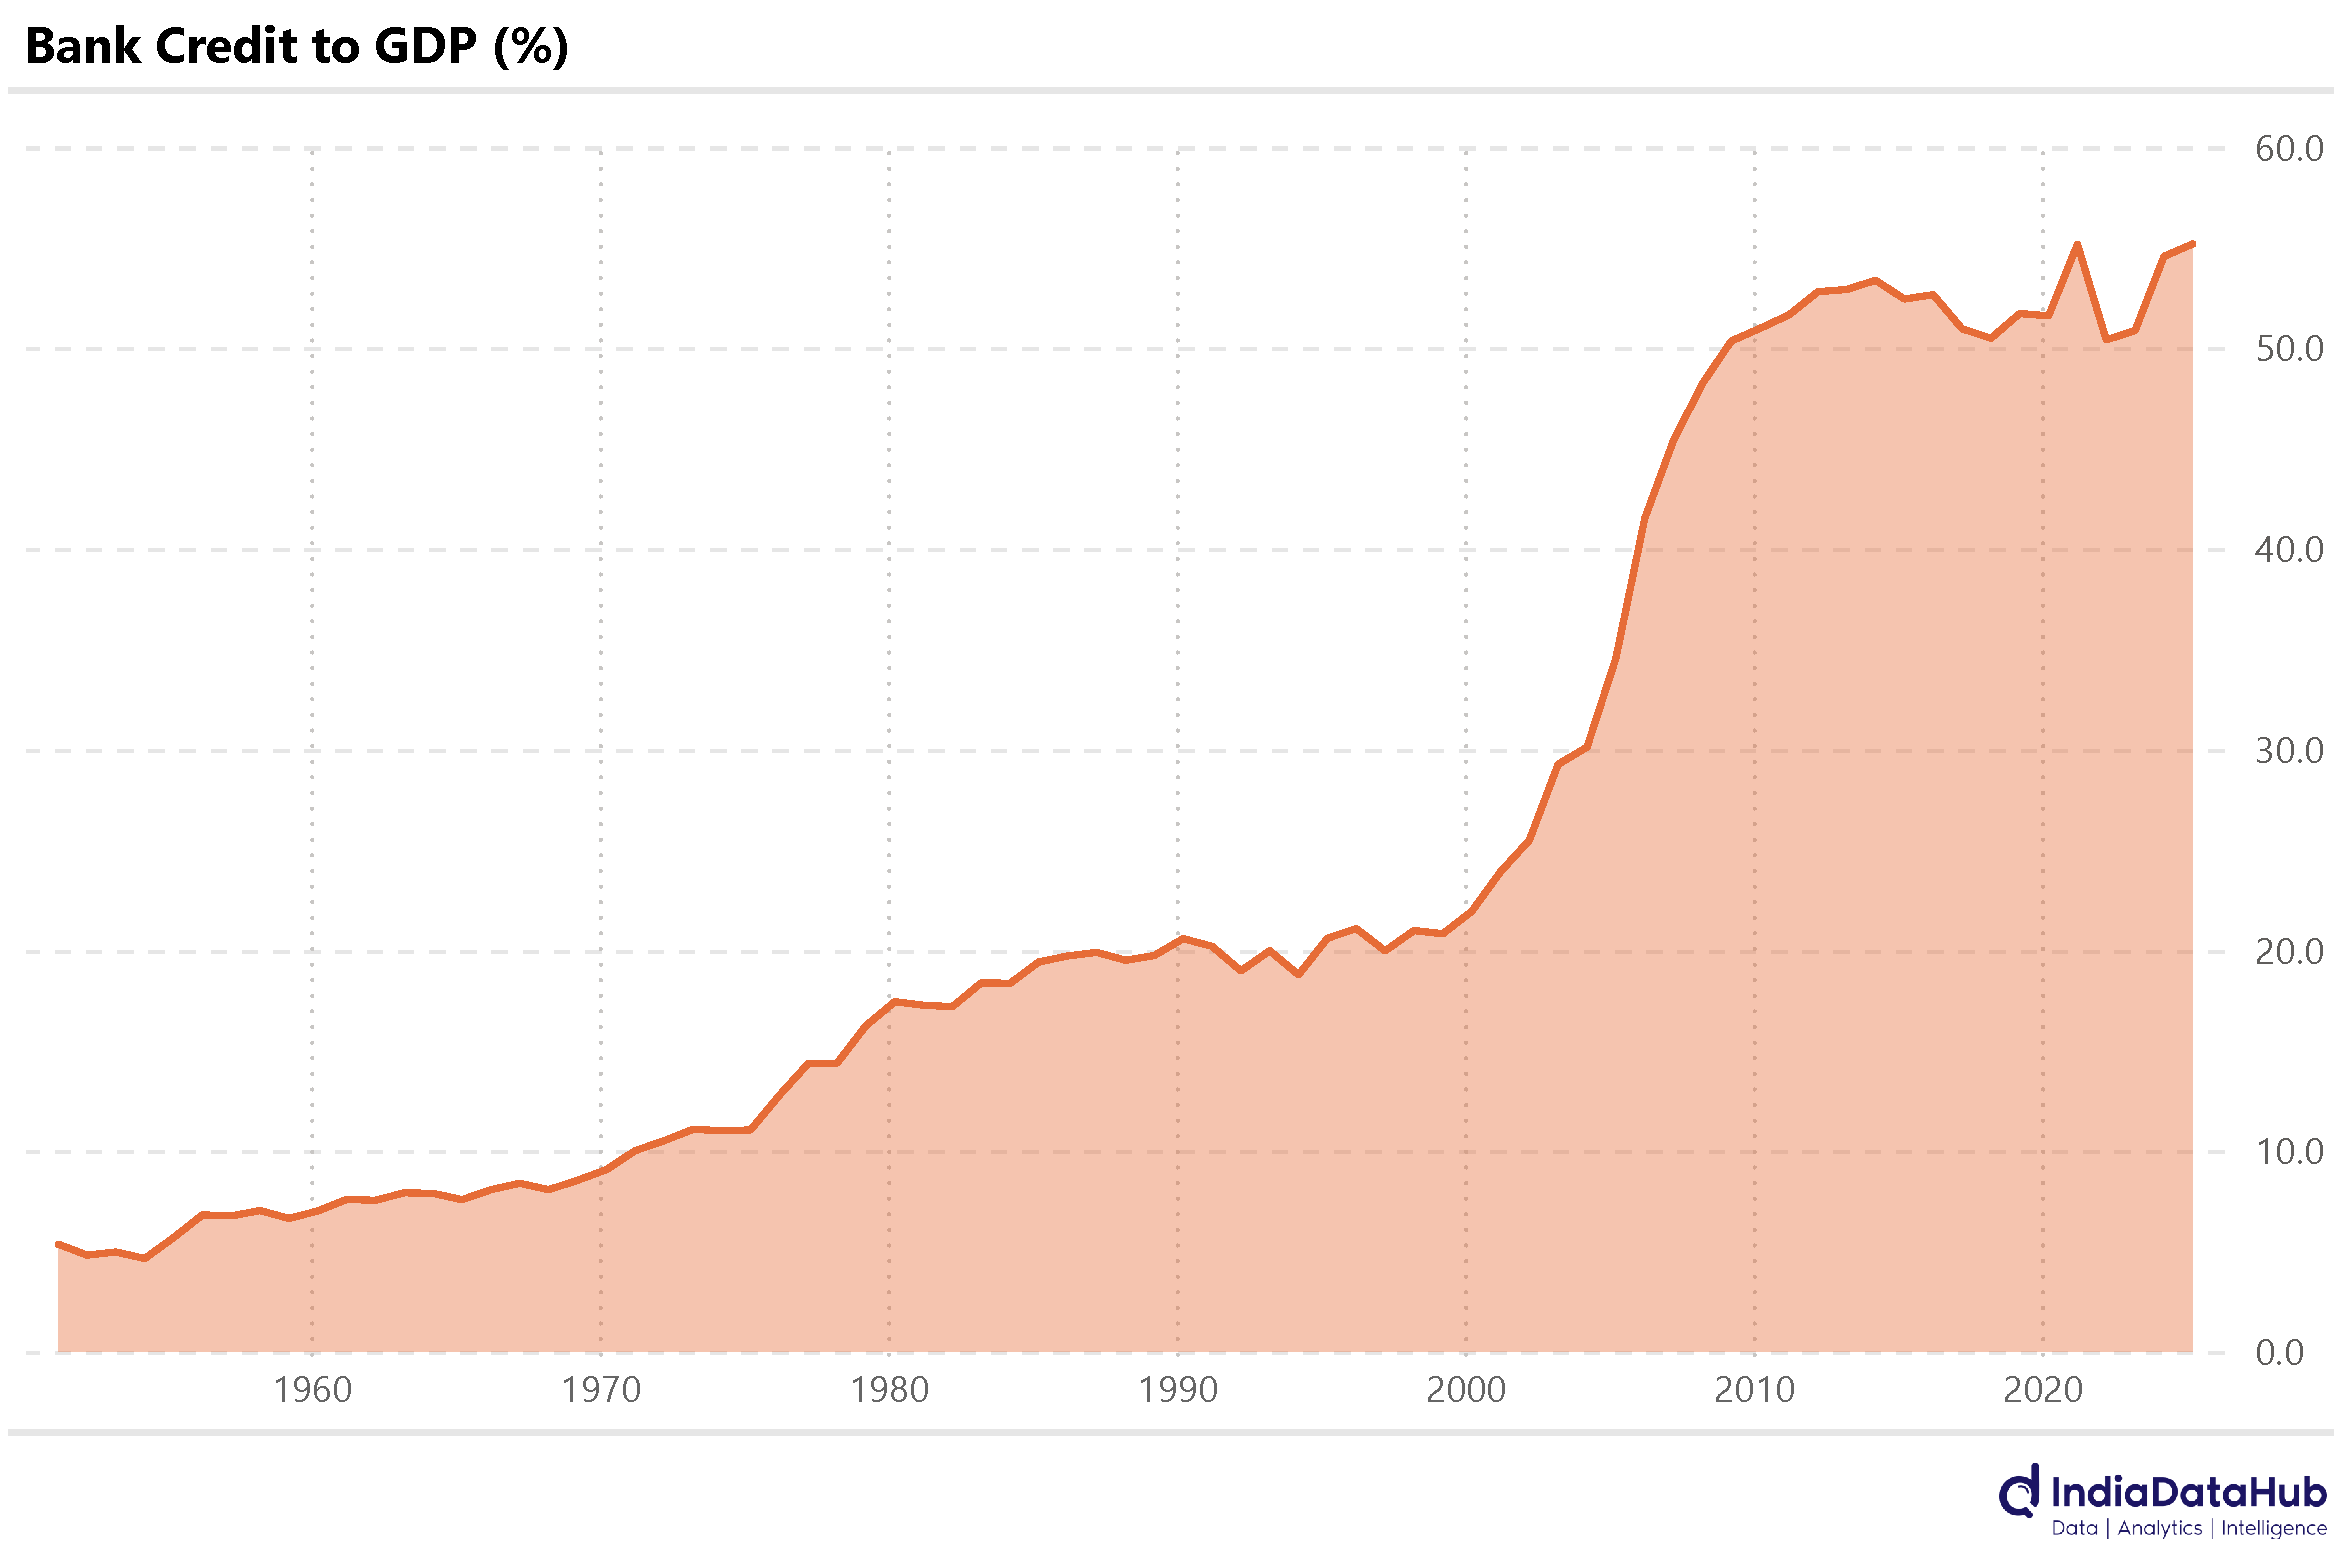
India’s nominal GDP grew by 9% during the June quarter, while bank credit grew by 10%. Thus, the bank credit to GDP ratio will rise further to ~56% in FY26 if this trend continues. So while it is correct to say that credit growth has seen a slowdown, it is incorrect to say that credit growth is low, for it is still above the nominal GDP growth.
Alright, let us change track to Global. This week began with CPI data for China. China’s CPI declined by 0.4% YoY in August. In the first 8 months of this year, China has seen negative CPI prints in 5 months. The decline in August was largely driven by a 2.5% drop in prices for food, tobacco, and liquor, along with a 2.4% decline in transportation costs.
In contrast to China, the United States reported a modest increase in inflation based on consumer prices. CPI Inflation increased from 2.7% YoY in July to 2.9% in August. In August last year, CPI inflation was at 2.5%. So while the labour market has slowed dramatically in the last few months (and has possibly been weak even before that, given the recent revisions in data), the inflation data is not particularly benign.
On the policy front, the European Central Bank kept all three of its key interest rates unchanged, with the deposit facility, main refinancing operations, and marginal lending facility rates holding steady at 2.00%, 2.15%, and 2.40%, respectively. In contrast, the central banks of Russia and Turkey cut policy rates this week. Turkey’s central bank reduced its policy rate by 250 basis points from 43% to 40.5%, while Russia’s central bank cut its policy rate by 100 basis points, bringing it down to 17%.
That’s it for this week. See you next week…