
Lower CPI, Rate Cuts, Strong exports to USA and more...
This Week In Data #124
In case you missed, we continue to expand our coverage of mutual fund data. We already track Industry aggregate data as well as fund house level data and detailed scheme portfolios. We now track daily scheme NAVs as well as daily and monthly scheme level AUMs with fairly long and consistent history. The data is accessible through our interactive website where you can compare different schemes and different data points, apply various functions, bookmark frequently accessed schemes, create custom charts and pin them to your workspace. In addition, the data can also be accessed through our Excel plugin and also through our APIs. See a quick demo from hereIn this edition of This Week In Data, we discuss:
CPI Inflation falls further to closer to 3% even as core inflation remains stable
Rate cuts likely to continue aiding both the economy and Banks
Exports see strong growth in April but Imports grow faster
Exports to USA continue to see sharp increase
FX reserves have recouped most of the fall this year
US CPI falls to 4 year low
Japan GDP rises to a 8-quarter high
CPI Inflation fell to 3.2% YoY in April. This is the lowest print in the last few years. While core CPI has edged above 4%, that is primarily due to higher precious metal prices. Excluding them, the core-core CPI remains stable at 3.4%, barely 20bps increase in the last few months.
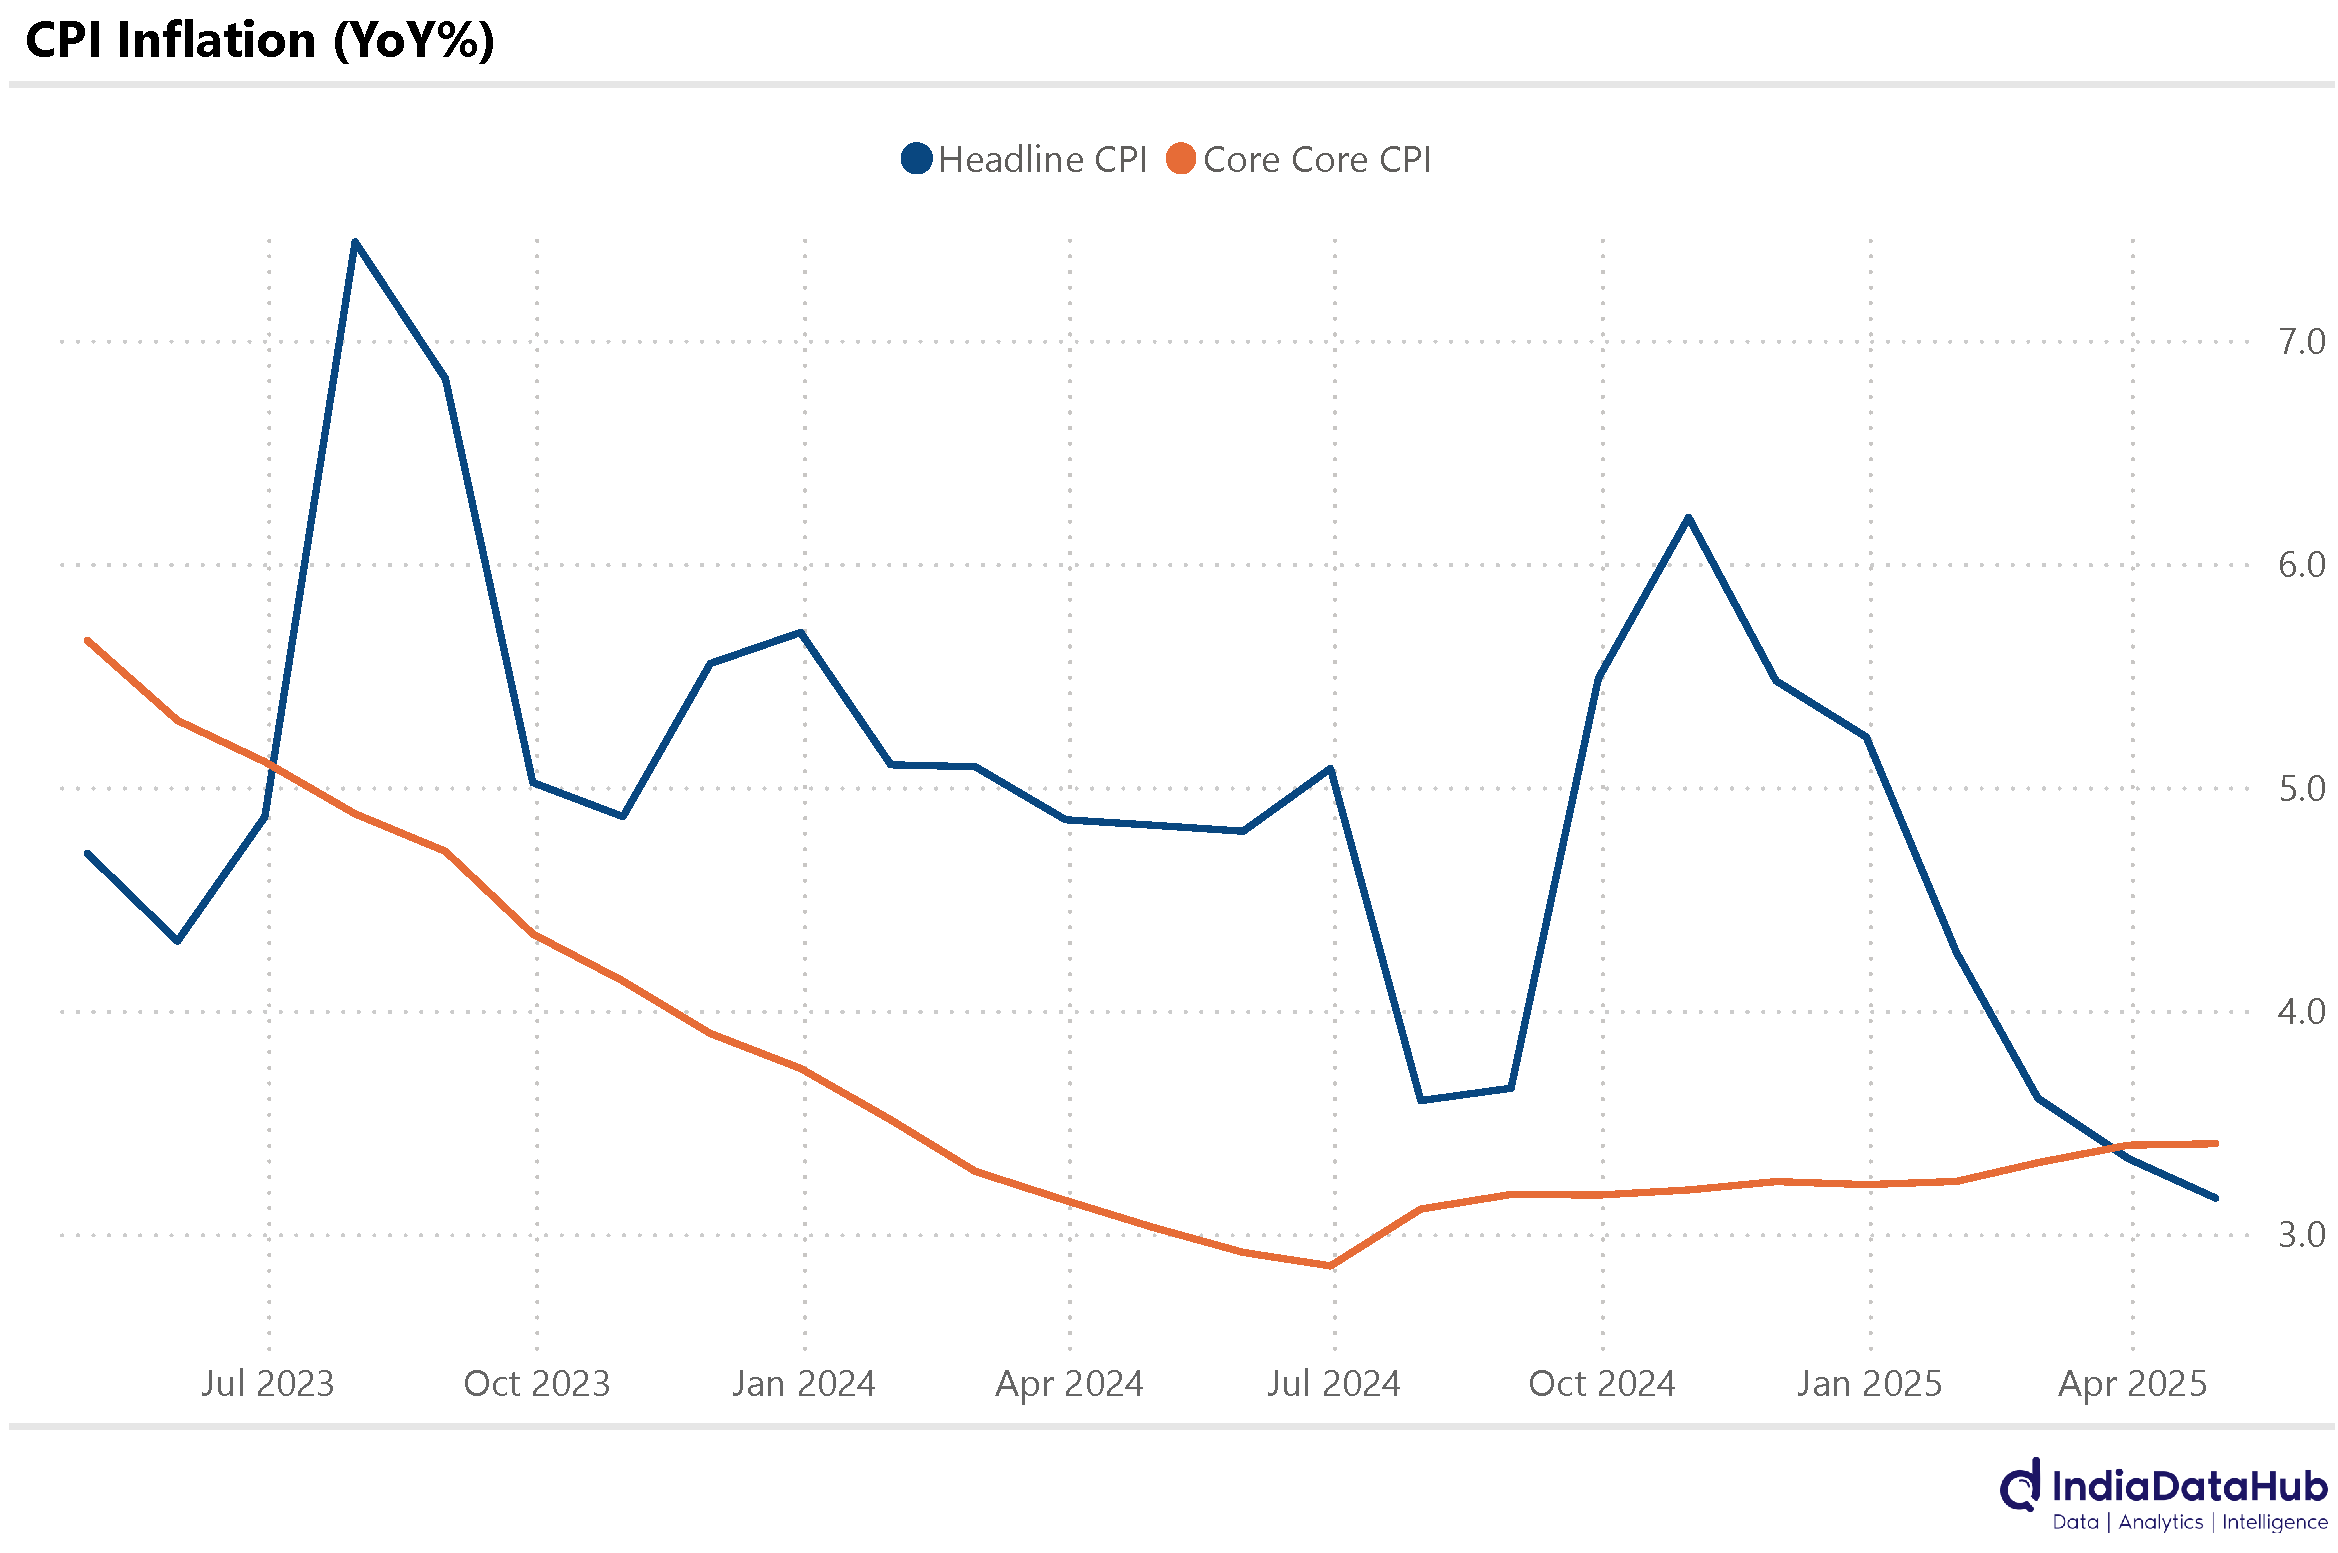
April is the third consecutive month that headline CPI inflation printed below 4%, and the June quarter will likely be the second successive quarter of sub-4 % inflation. The odds of a further rate cut in August have increased substantially. Monetary easing will likely continue.

Effective lending rates in the economy have stabilised for the last few months. The lending rate for all fresh loans given by the scheduled commercial banks has increased by ~185bps over the past three years. The recent rate cuts from the RBI have happened too soon for them to have passed on to the economy. But the 50bps rate cuts so far and possibly another 25bps or more coming will start to impact the economy towards the end of the year.
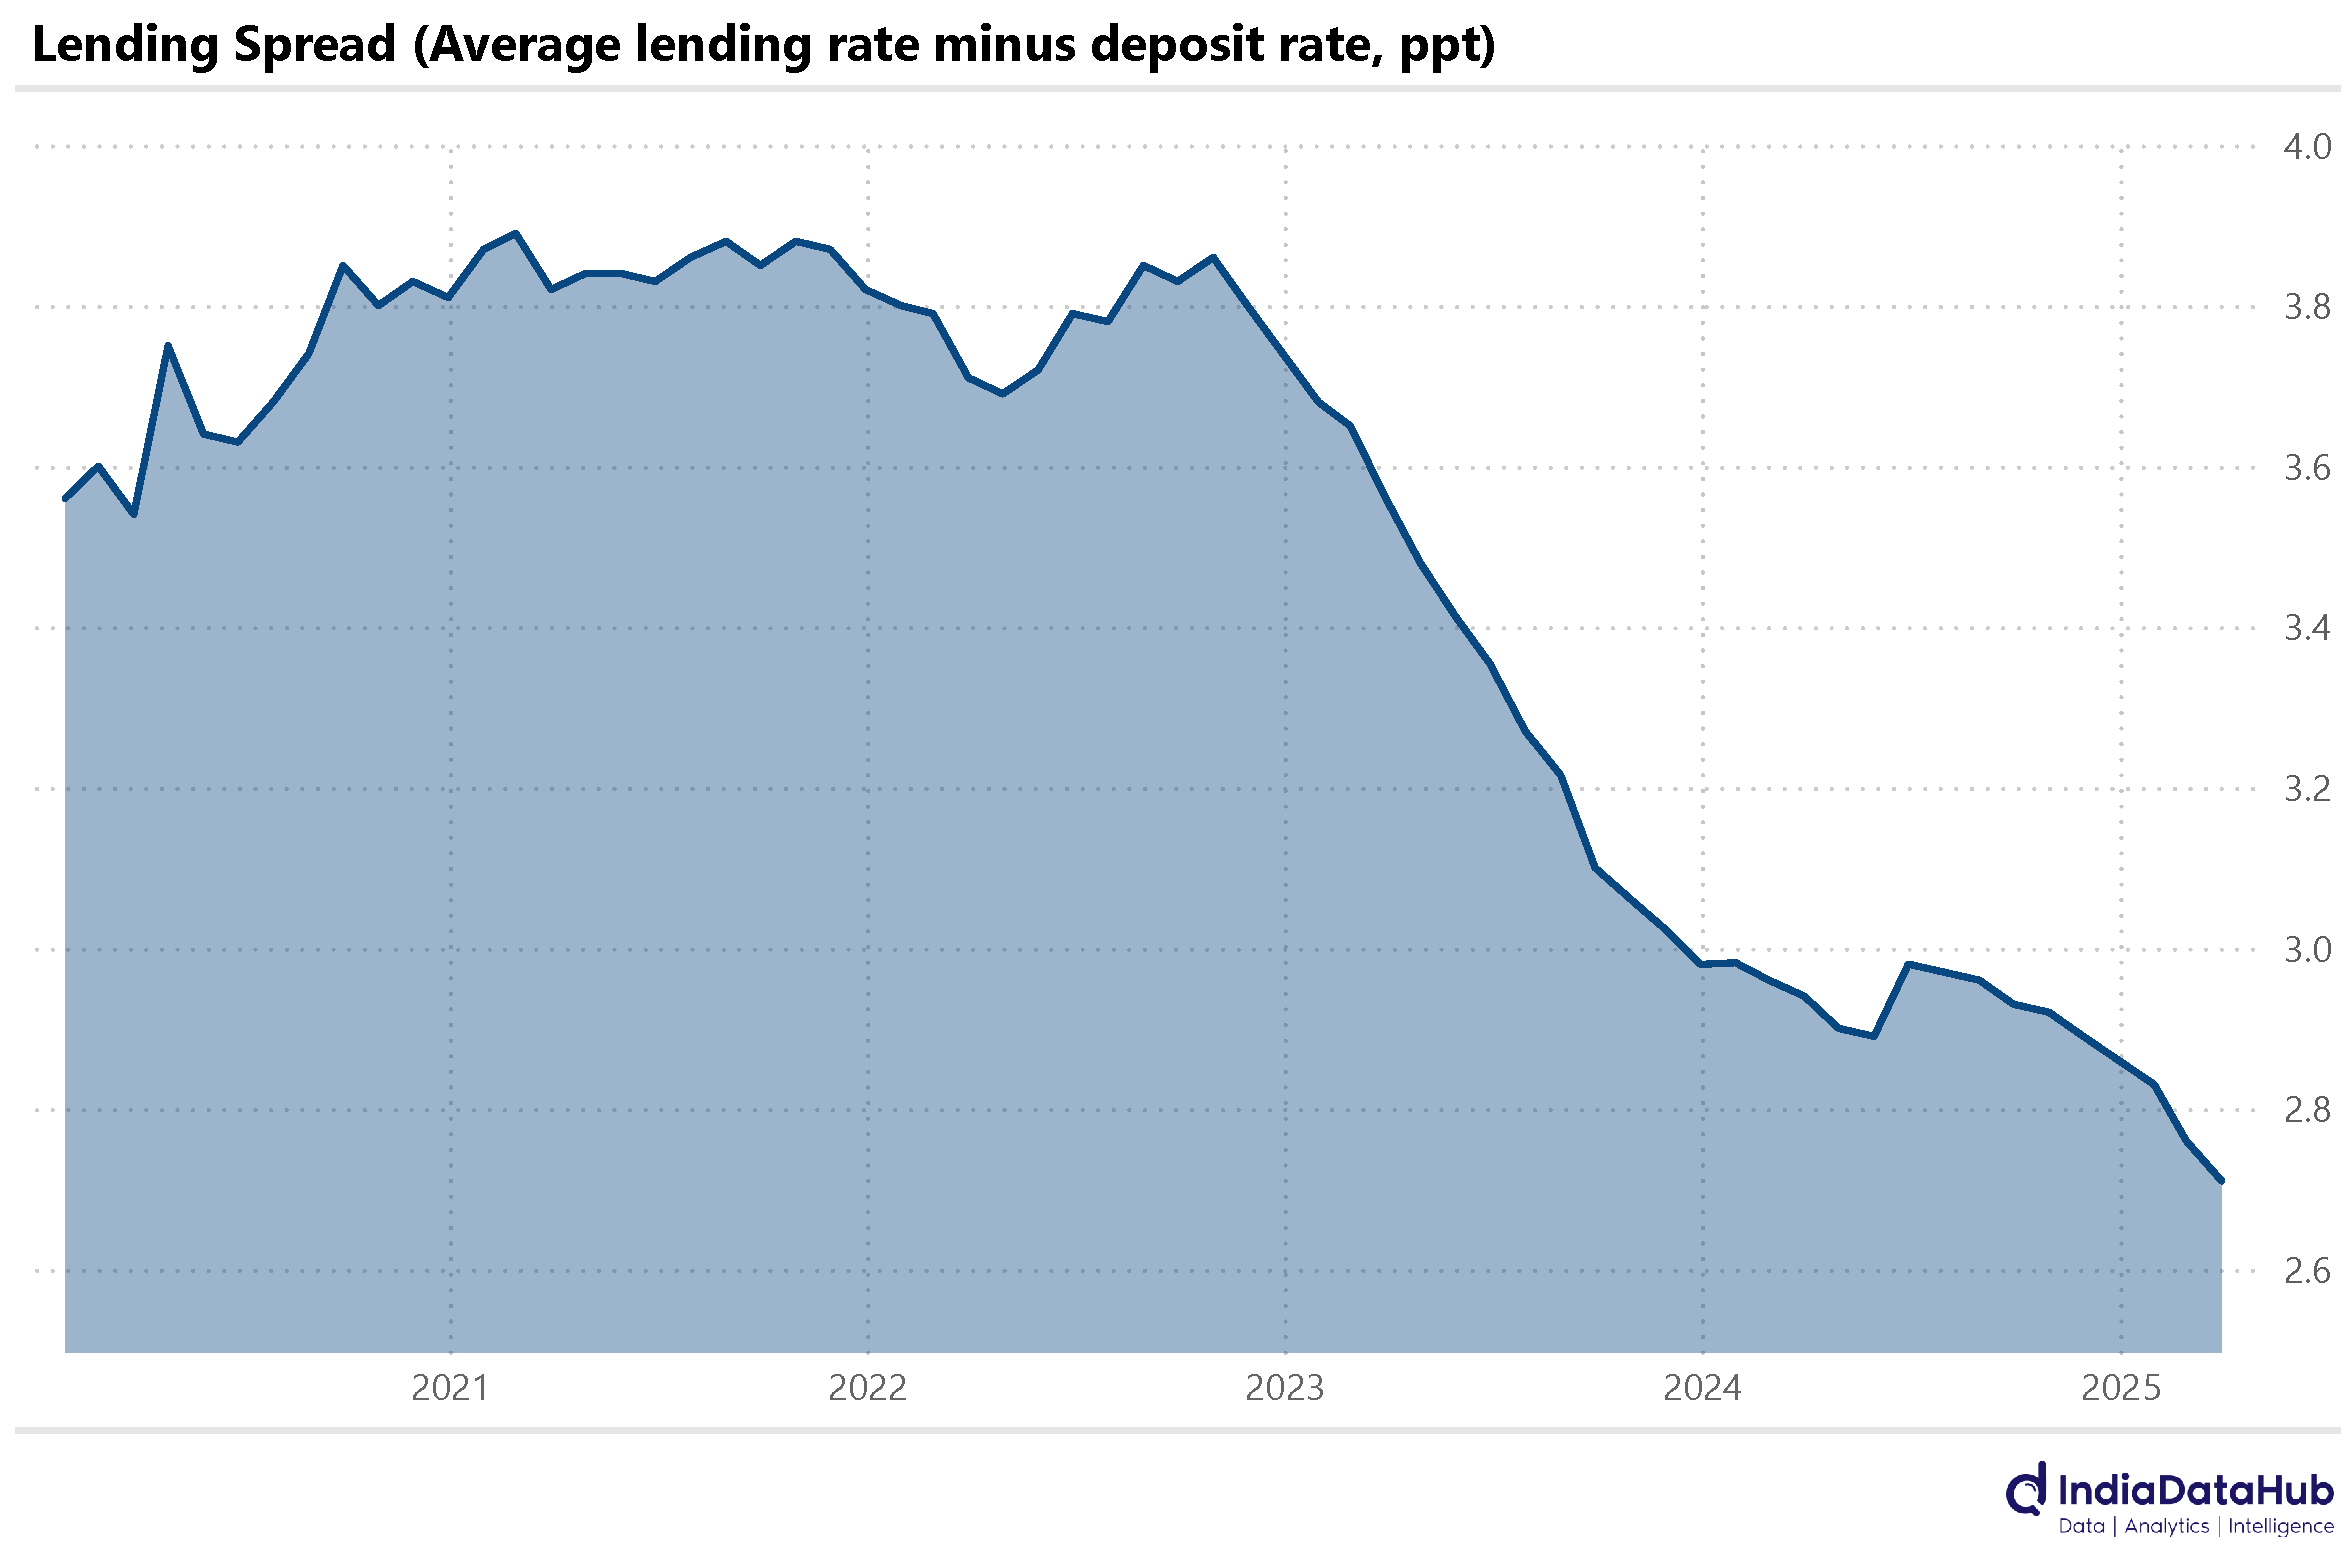
The other beneficiary of rate cuts will be banks (and NBFCs). The spread between the weighted average lending rate of banks and the weighted average deposit rate has fallen from 3.5 ppt 3 years ago to 2.7 ppt as of March. As interest rates go down, banks should see an increase in their spreads.
Merchandise exports rose 9% YoY in April, after 5 months of negative or close to zero growth. Electronics exports were amongst the fastest-growing categories with almost 40% YoY growth. Engineering goods, as well as Gems & Jewellery, also saw a double-digit growth.
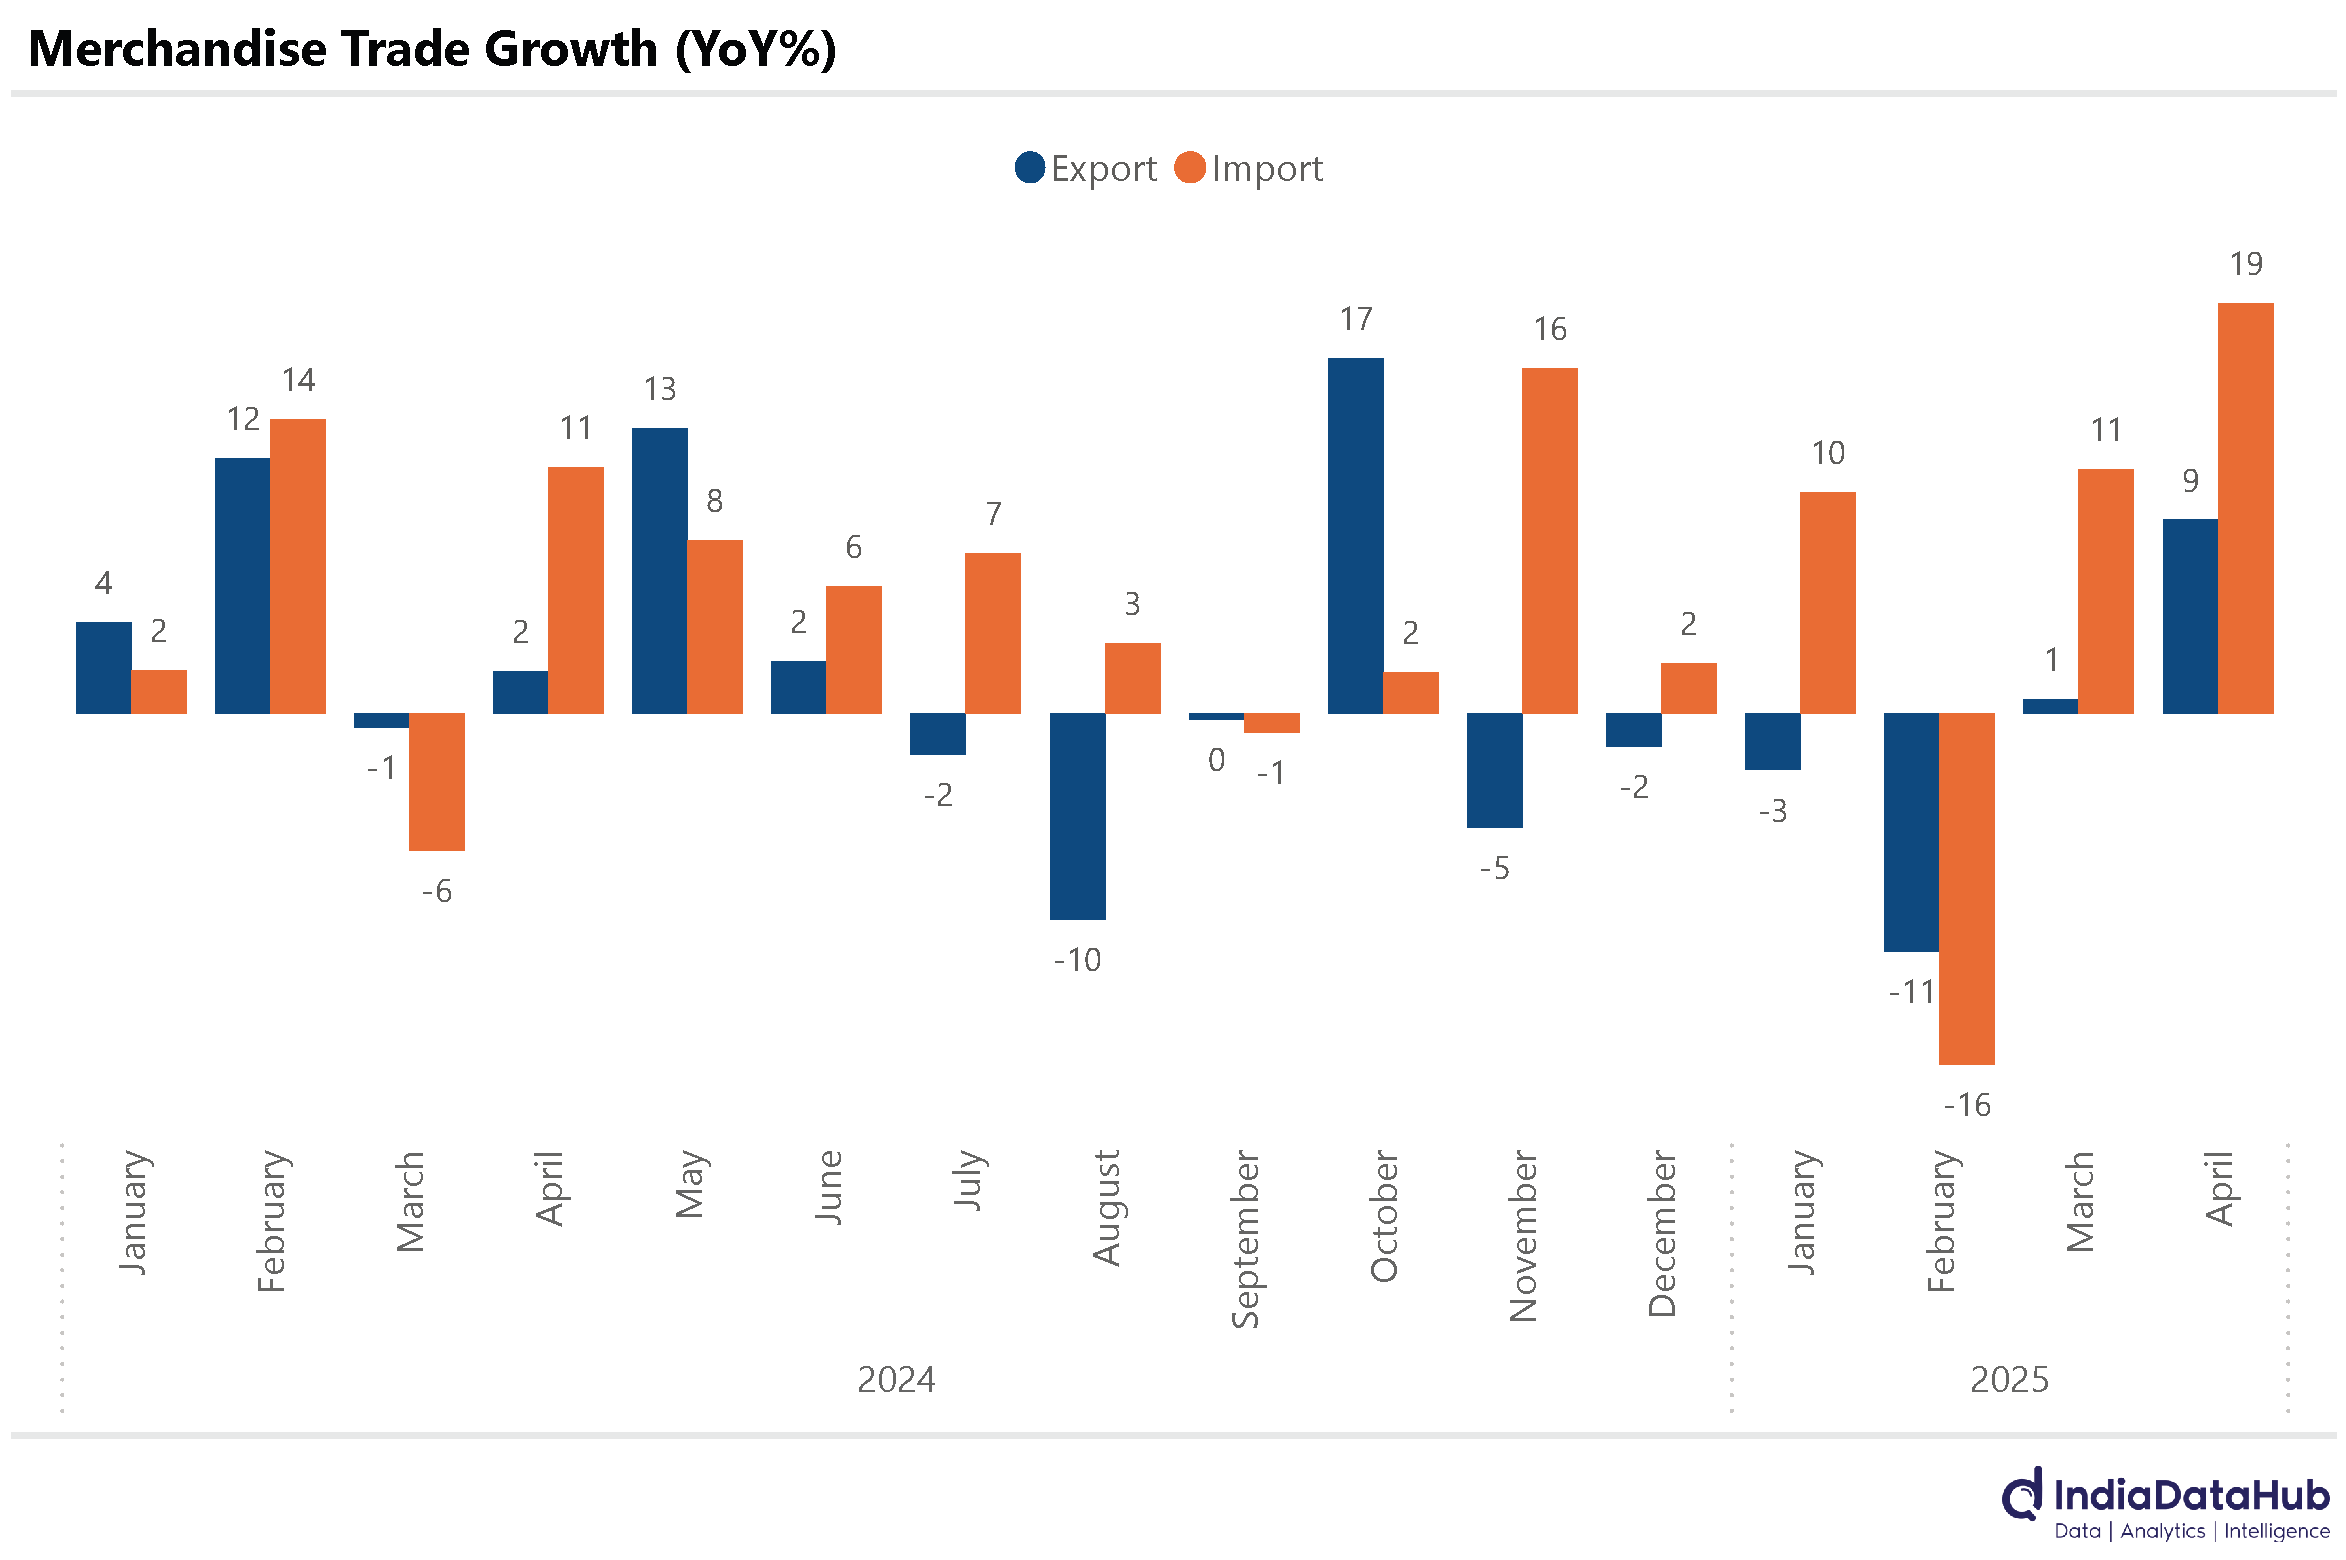
Imports however rose by 19% YoY, driven by a 25% increase in petroleum imports and over 20% increase in machinery imports. Imports of electronic goods rose 30% YoY in sync with the growth in exports.

Trade deficit rose by US$7bn on a YoY basis to the highest in the last 4 months. And at US$26bn, it is US$4bn above the average monthly deficit of FY25. So a slight concern at the start of FY26, but we are still very early in the year.

The one trend that has continued, though, is the sharp increase in exports to the USA. In April, they rose 27% YoY, following the 35% growth in March. Over a fifth of India’s exports are now to the USA, more than 2x that to any other country. It remains to be seen whether this increase in exports reflects front loading of imports by the USA in anticipation of tariffs (most likely) or whether there is any structural element specifically to India.
Foreign exchange reserves continue to increase. As of May 9th, they had increased to US$690bn, rising almost US$65bn from the bottom of early January. More importantly, they are just US$15bn short of the all-time high of US$705bn in September last year.

So a combination of the influx of large FPI flows in recent months, coupled with the US Dollar depreciation, has allowed FX reserves to more or less be fully recouped.
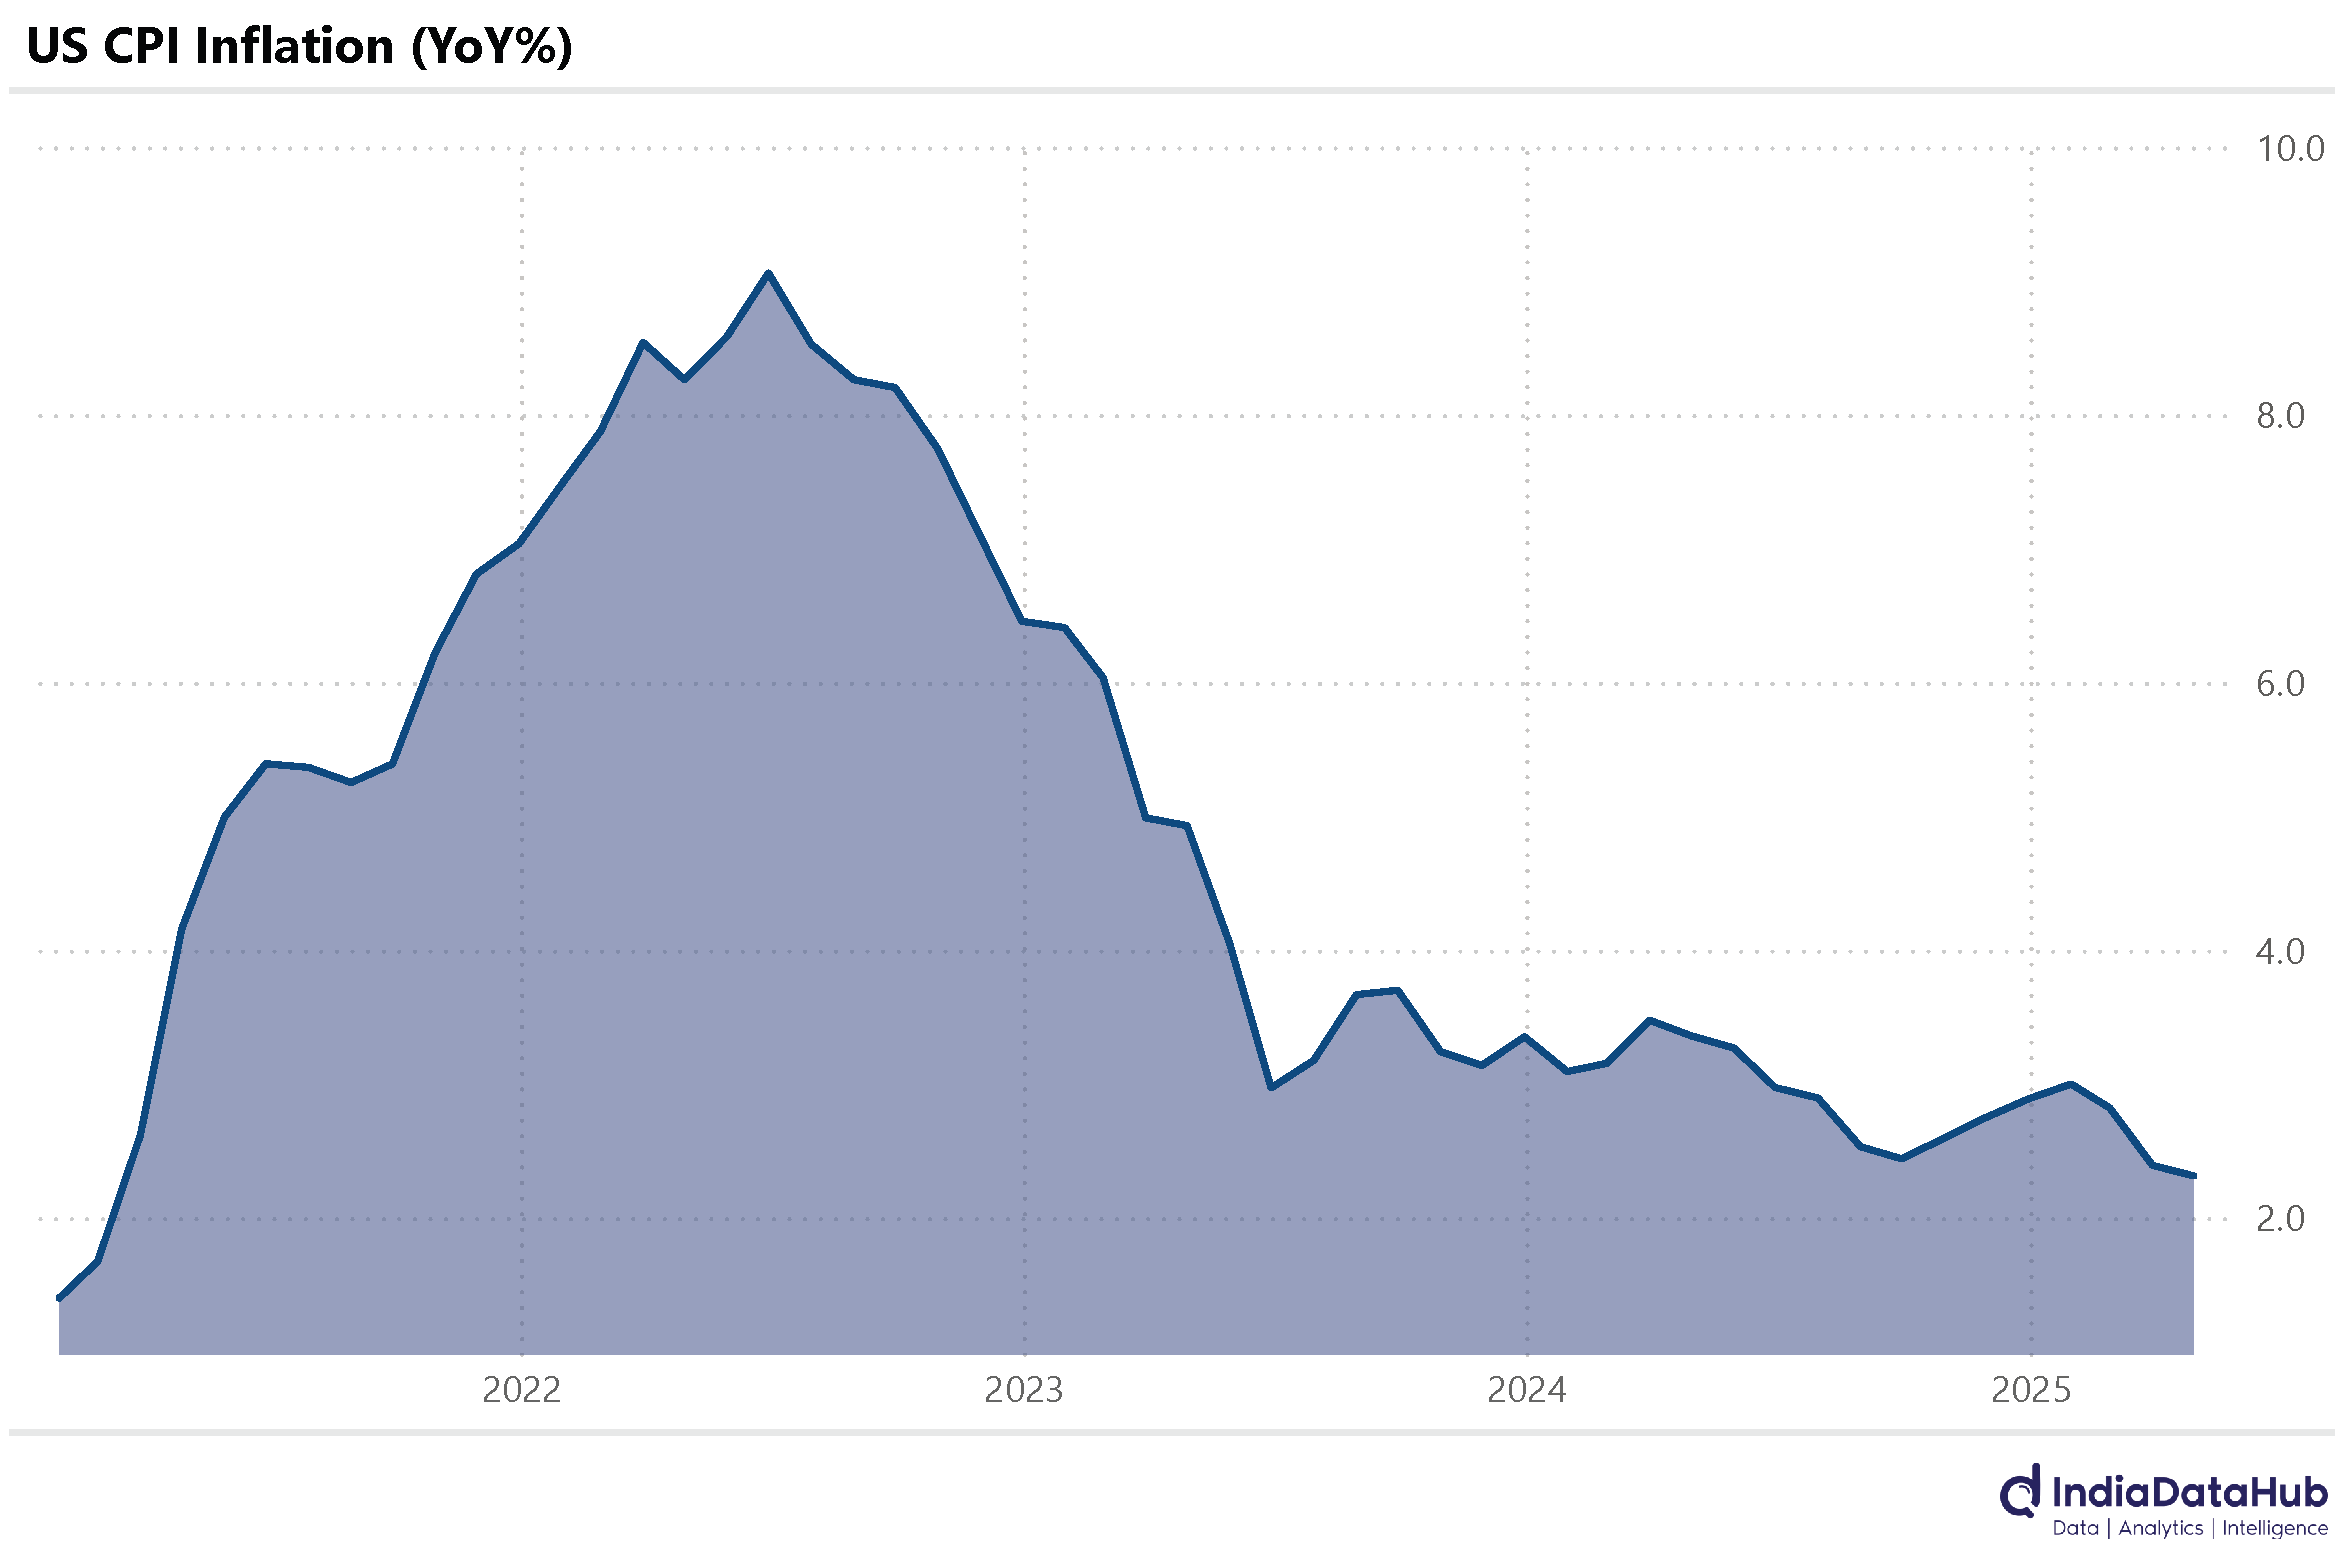
On the Global side, the US CPI moderated further. Headline CPI fell 10bps to 2.3% in April. This is the third consecutive month of decline and the April CPI is lowest level since February 2021 when CPI had printed at 1.7%. Among the major components of the inflation basket, energy prices decreased by 3.7% year-on-year in April, while food prices increased by 2.8%. However, the core CPI rose by 2.8% year-on-year, slightly higher than the headline CPI.
On the other hand, China saw deflation for the third consecutive month in April. CPI printed at -0.1% YoY in April.

Lastly, Japan released its advanced preliminary estimate of GDP this week. According to the latest data, Japan's GDP grew by 1.6% year-on-year in the March quarter, marking the highest year-on-year growth in seven quarters. Some of it reflects low base of last year when GDP had declined. But nevertheless, a close to 2% GDP growth for Japan is a fairly positive outcome.
That’s it for this week. See you next week…