
New GDP series, Recovering FDI, Record services surplus and more...
This Week In Data #155
In case you missed, we now track the active weights of mutual funds across stocks and sectors. Calculated by comparing the actual portfolio weight of every equity scheme relative to an appropriate basket of stocks that is representative of that scheme category. We build this data bottom up and so it is available at an individual scheme level and aggregate it up across all equity fund categories and the entire equity holdings of AMCs.
In this edition of This Week In Data, we discuss:
New series of GDP is here and GDP seems to be humming along fine
New series lowers growth rates for last two years and also lowers the size of the GDP
Corporate tax collections have seen sharp acceleration in recent months while income tax collections remain sluggish
FDI inflows improve sequentially but higher outward FDI keeps total FDI at modest levels
Services exports continue to see strong growth and trade balance at record highs
US Trade deficit widens sharply in December as trade with China continues to shrink
So India’s economy grew by 7.8% YoY during the December quarter, down slightly from the 8.4% growth during the September quarter. For FY26, the economy is likely to grow by 7.6% YoY, higher than the 7.1% in FY25 and 7.2% in FY24. This is as per the new series of national accounts released on Friday, with FY2022-23 as the base year. Key take away, the economy seems to be humming along fine.
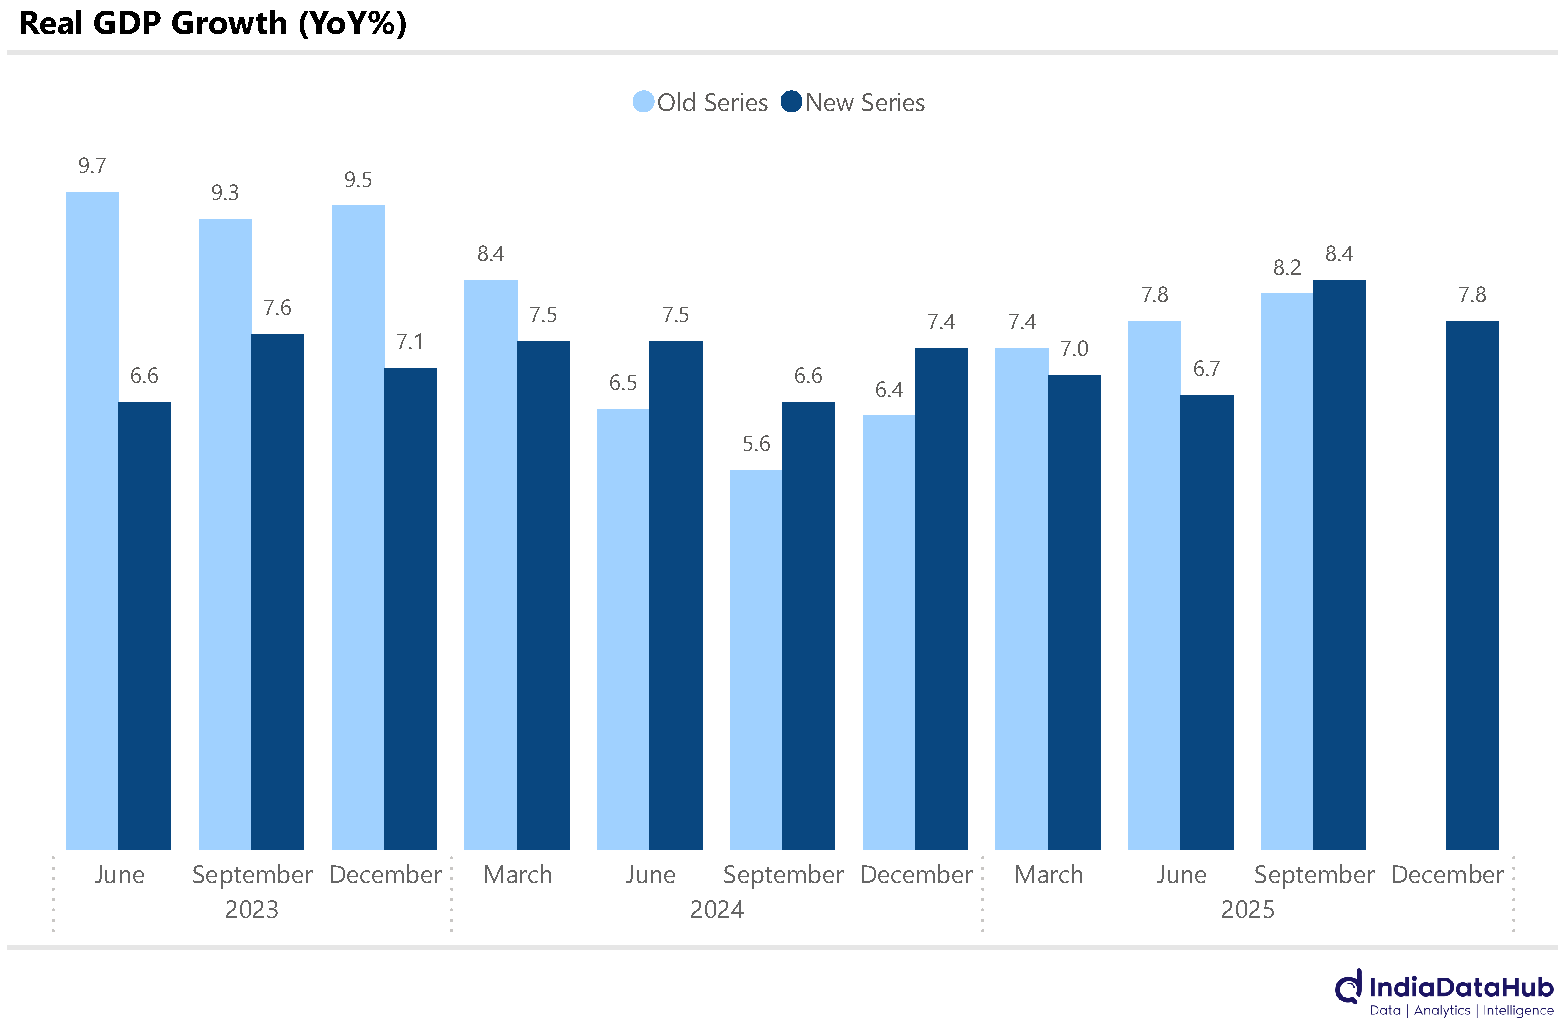
The new series with newer and updated data sources, as well as revised methodology, closely aligns with the changes in the economy in the last decade or so. Not surprisingly, there is a significant change to growth rates earlier reported, and the key takeaway is that, in general, growth rates for the last 2-3 years have generally been revised downwards. This implies that the older series was overestimating growth, especially in FY24. Cumulatively over the past two years (FY24-25), the real GDP growth rate has seen a downward revision by ~70bps.
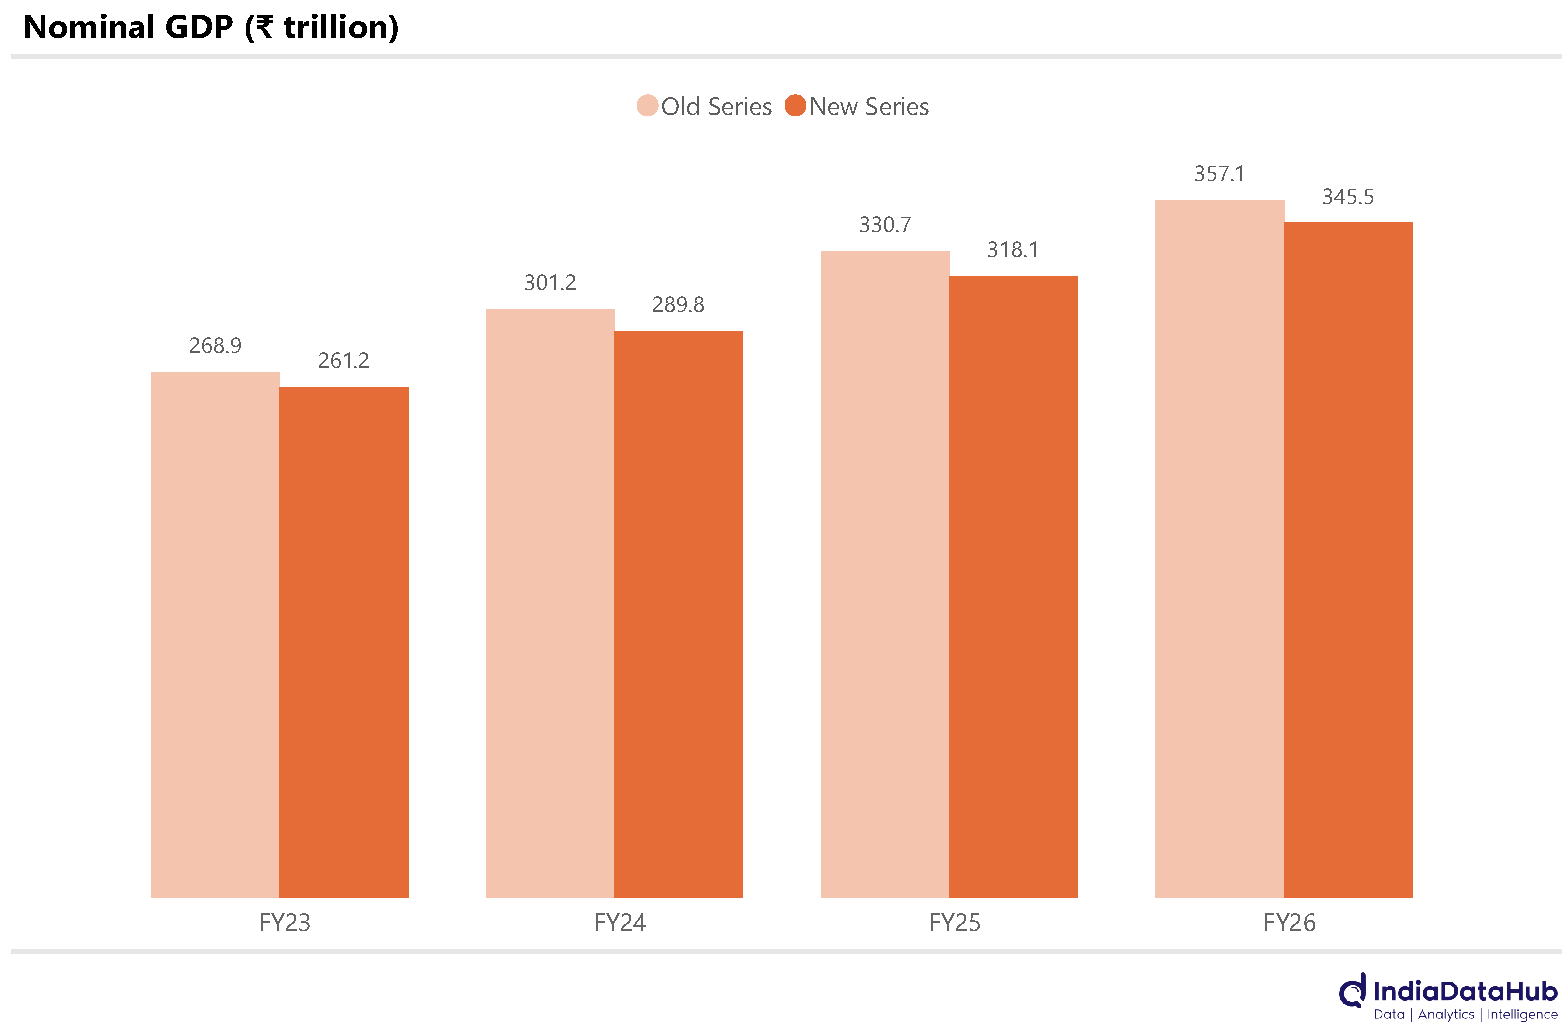
The other notable feature of the new series is that it actually reduces the size of the economy slightly. The nominal GDP under the new series is ~3-4% lower than that under the old series. Given that some of the scepticism over the earlier reported GDP data was due to the perception that they were overstating growth, this downward revision should help acceptance of this series amongst the sceptics.
Corporate tax collections more than doubled in January on a YoY basis. While January is not a large month for corporate tax collections, it will be the 4th consecutive month of strong growth in corporate tax collections. Over this period (Oct-Jan), corporate tax collections increased over 35% on a YoY basis as against a modest 1% growth during the six preceding months. This increase in corporate tax collections lines up with corporate profitability data, which has shown two consecutive quarters of double-digit growth.
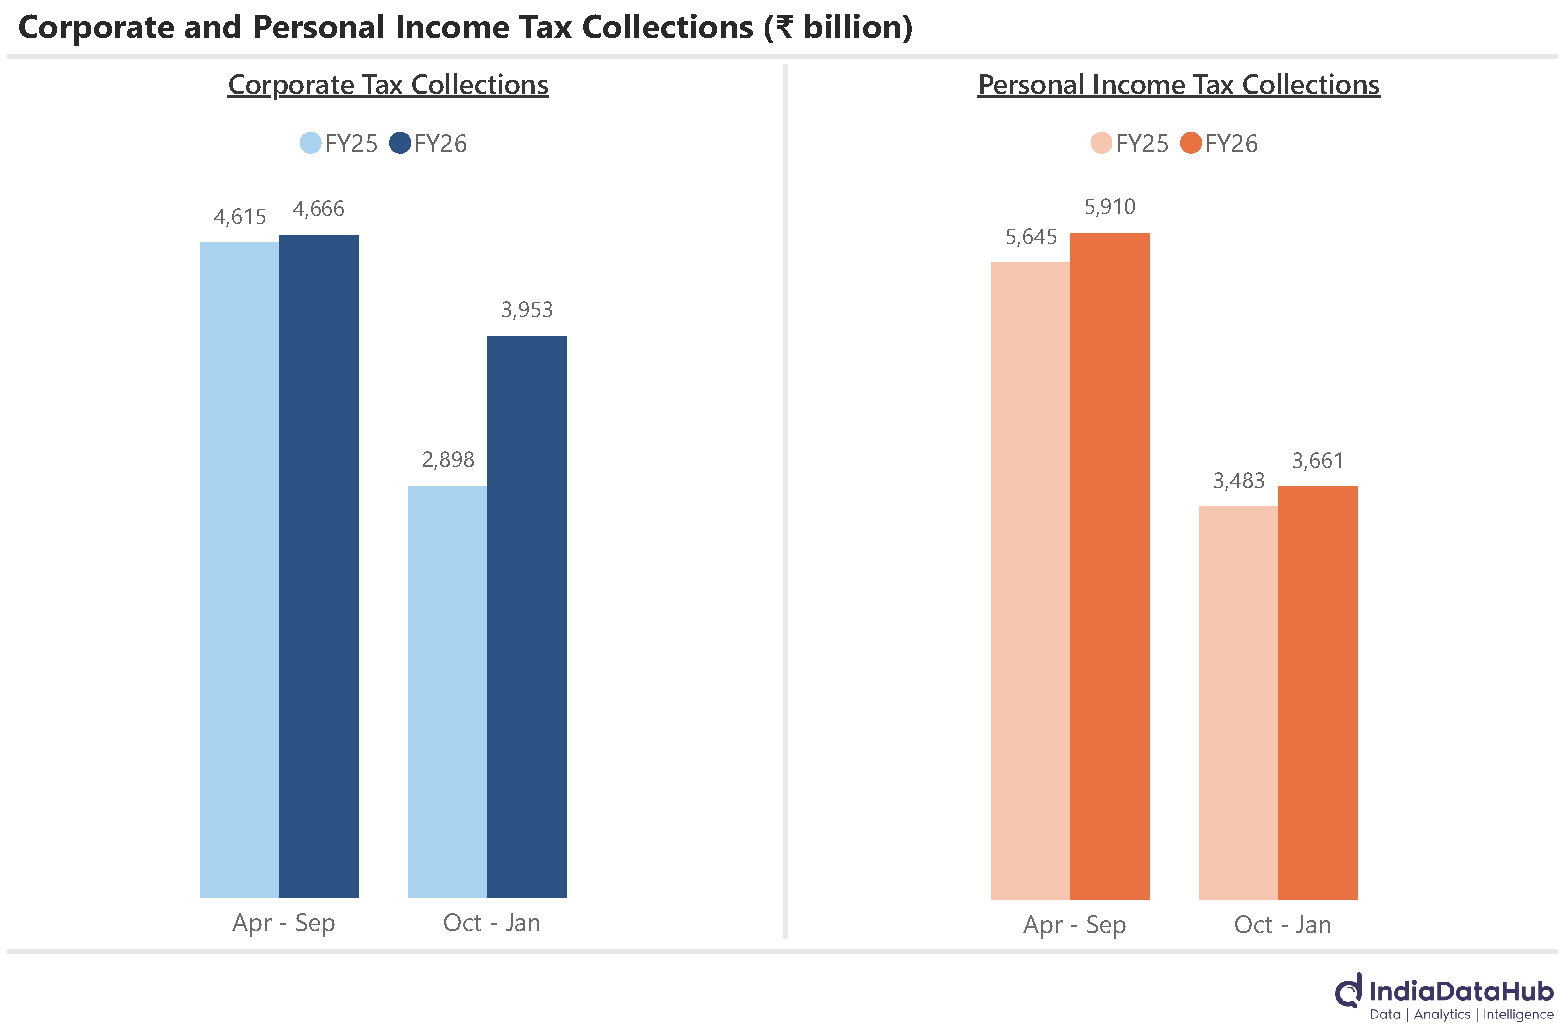
Personal income tax collections have not seen an uptick though. The last 4 months have seen a personal income tax collections grow by 5% YoY, broadly the same growth rate as in the preceding 6 months.
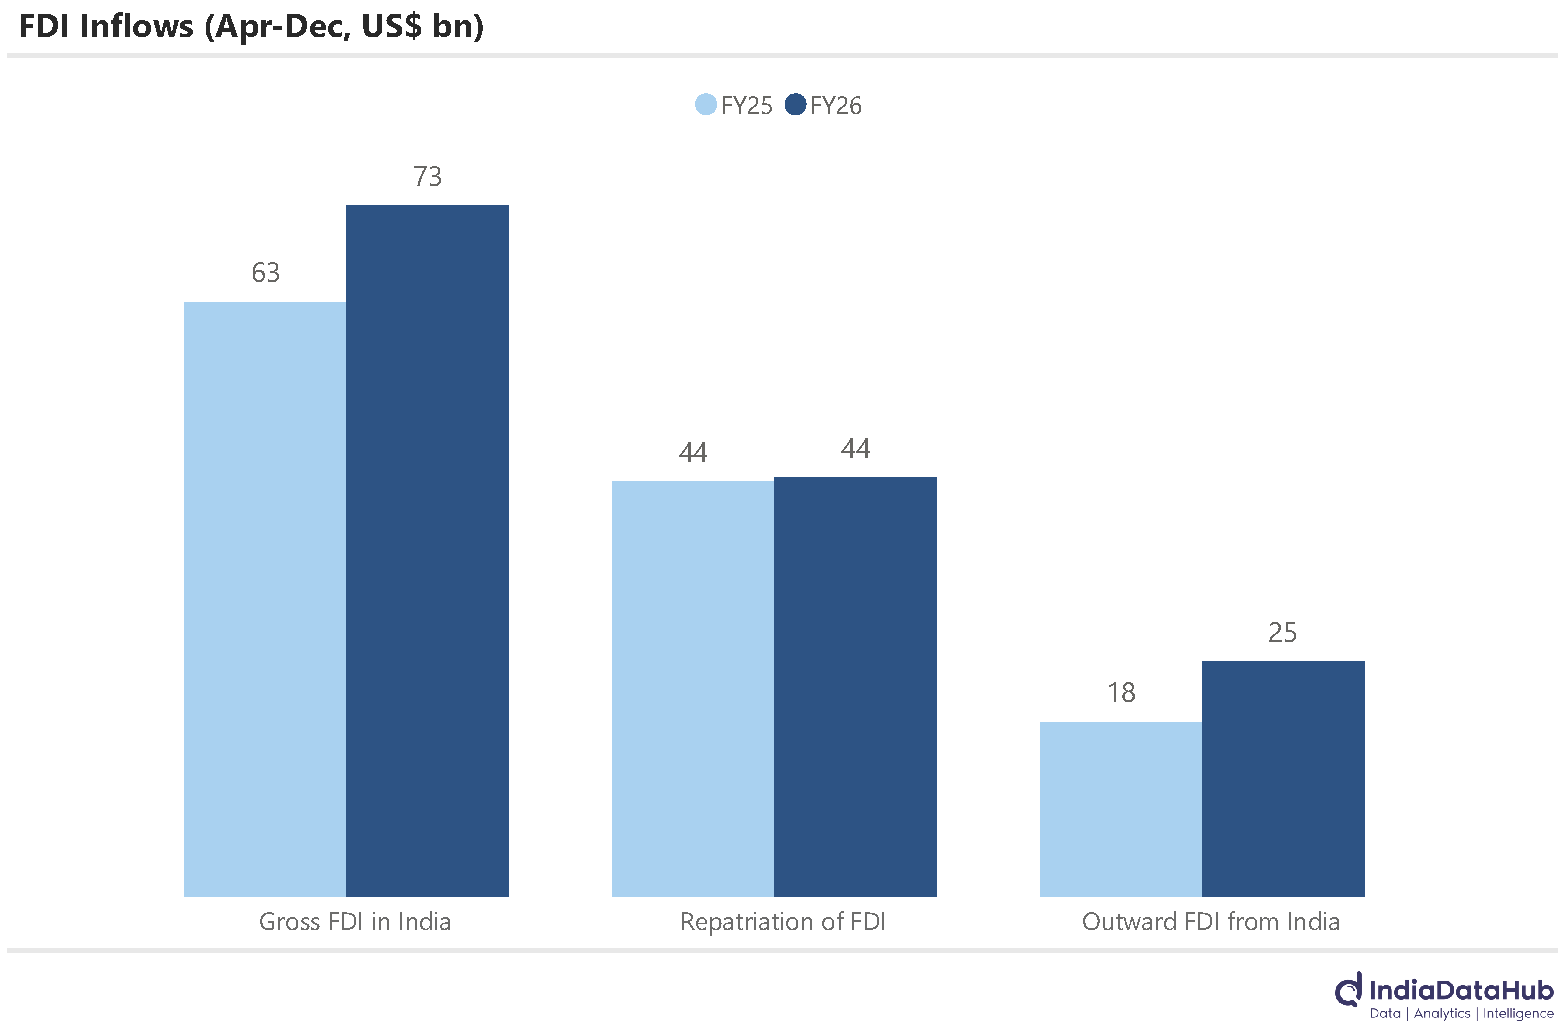
FDI Inflows continue to improve sequentially. In the first 9 months of this year (Apr-Dec), FDI flows into India increased 50% YoY to US$29bn. This was driven by a 15% increase in gross inflows while repatriation of existing FDI was largely flat. That said, outward FDI from India is also rising – YTD this has increased by almost 35% YoY. And this has meant that in absolute terms, the FDI received by India, on a net basis, was a modest US$4bn between April and December of FY26.
Services exports have continued their strong momentum in recent months. January saw services exports grow 10% YoY, down slightly from the 13% growth in December but broadly the same pace as in the recent few quarters. Imports have surprisingly seen a sharp slowdown, with January seeing services imports being largely flat on a YoY basis.
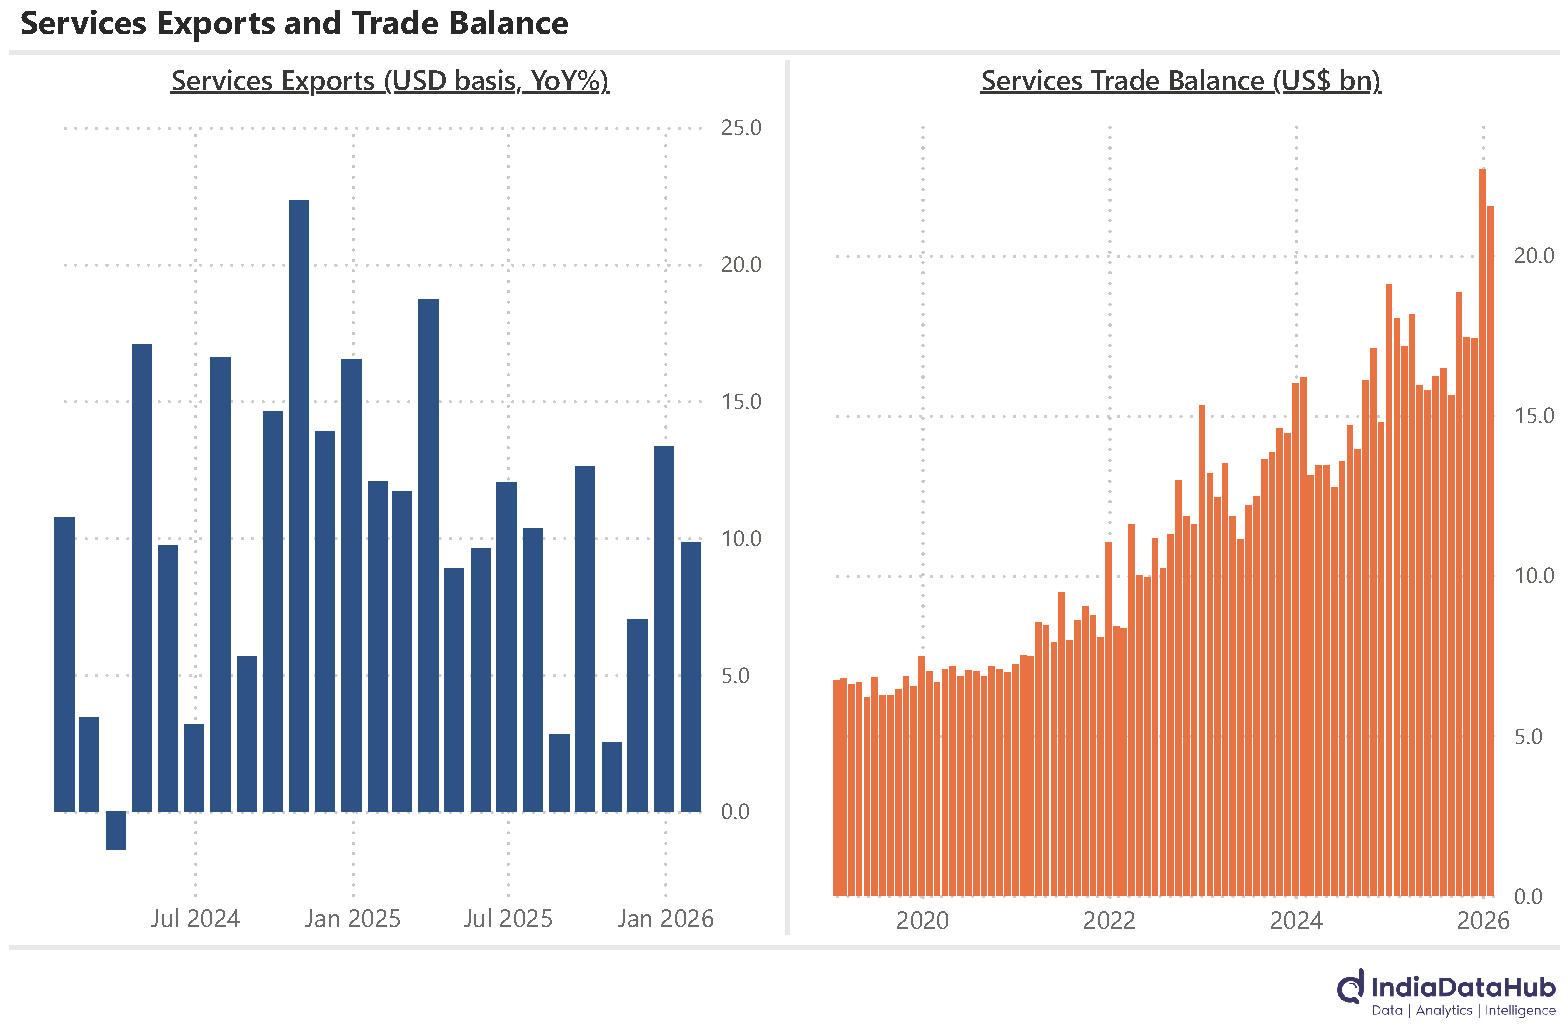
January was thus the second consecutive month of over US$20bn services trade surplus, the highest ever. The backdrop for this, of course, is the rising risk of AI disrupting India’s IT exports. So, we will be watching this data closely over the next few months.
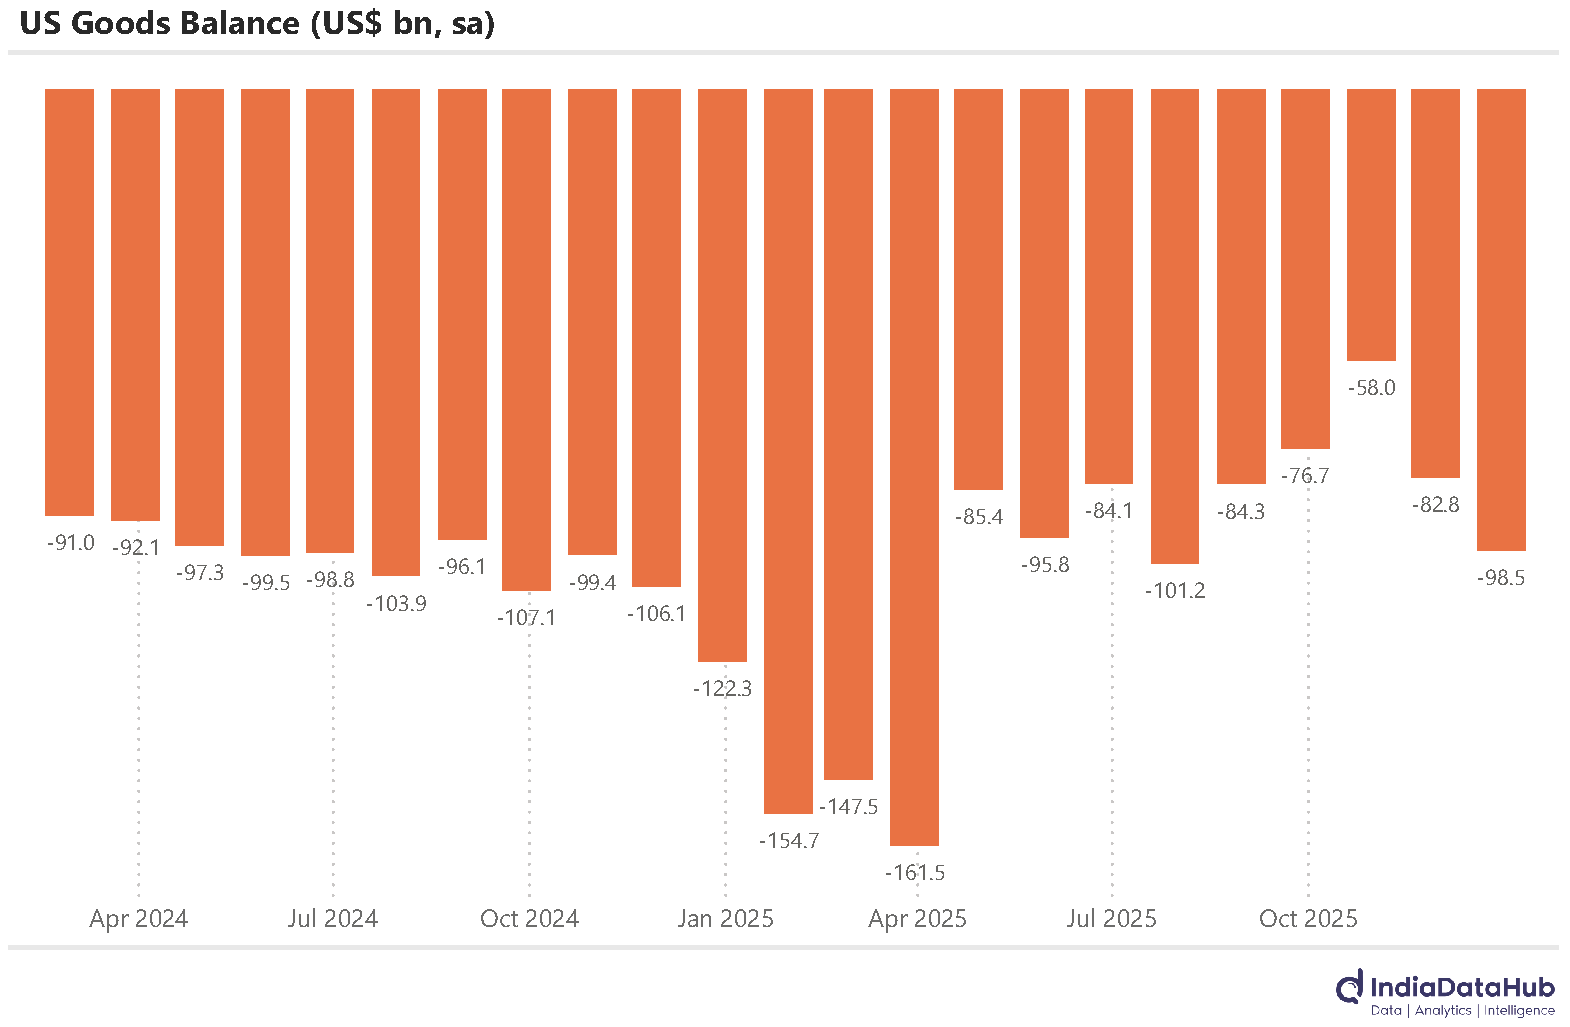
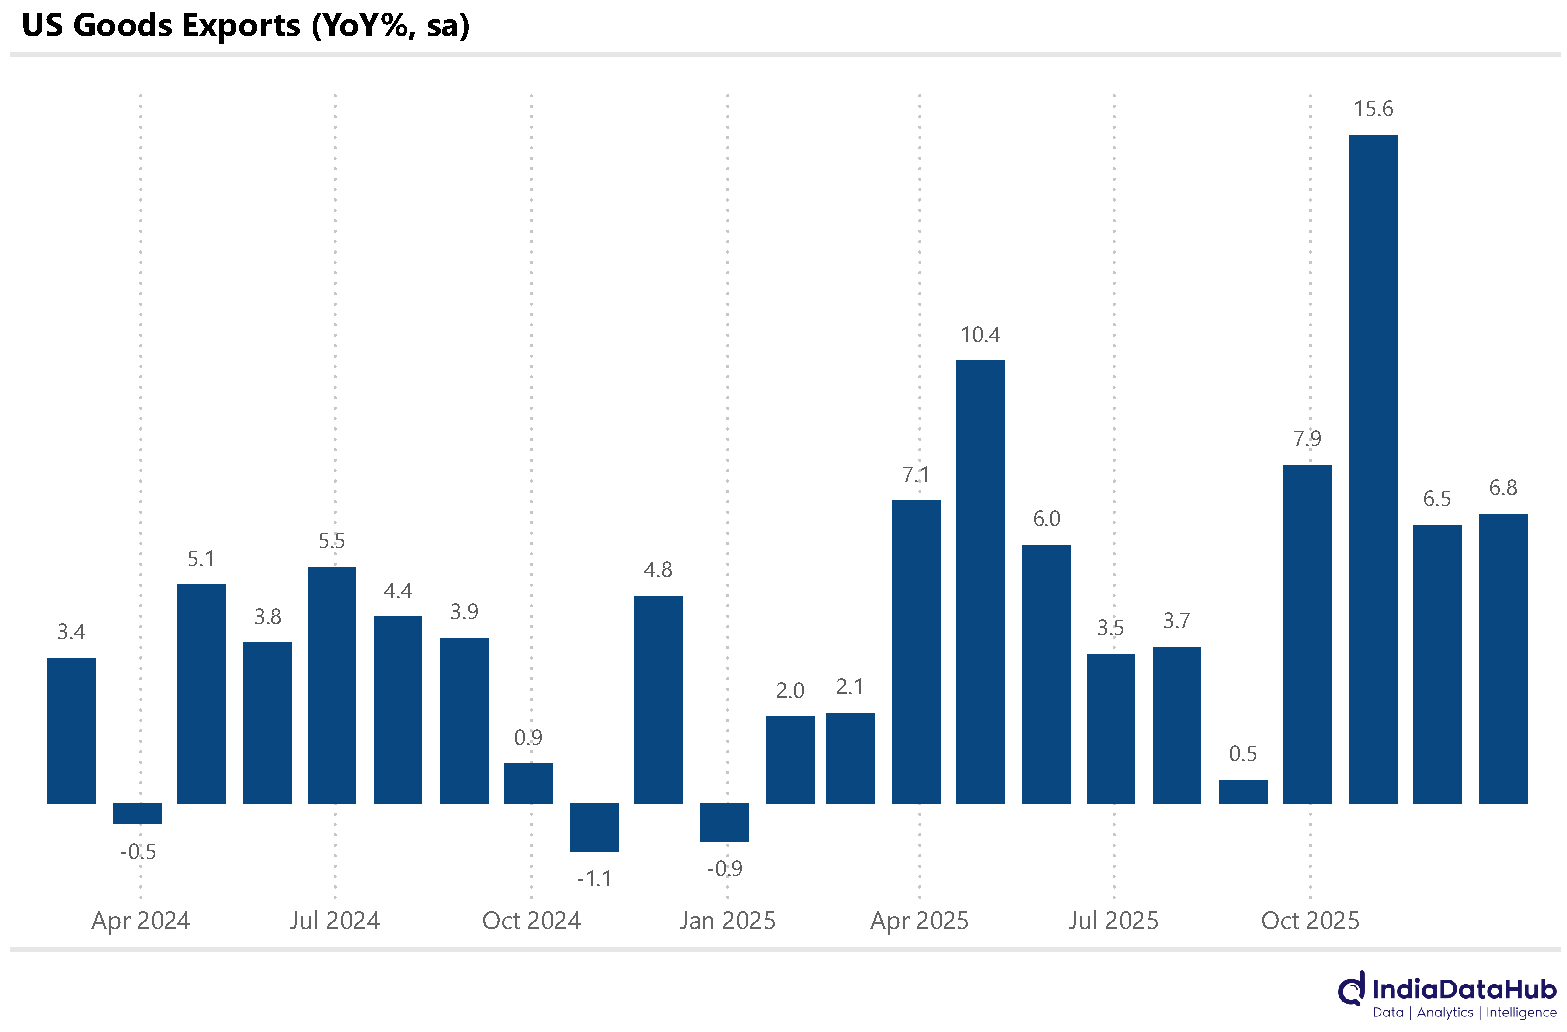
In December 2025, the US goods trade deficit widened sharply, increasing by $15.8 billion to reach $98.5 billion, a 19% MoM rise on a seasonally adjusted basis. This is the highest level of the deficit since July 2025. This increase was driven by a 3% MoM decline in exports, while imports rose 4% MoM (seasonally adjusted basis).
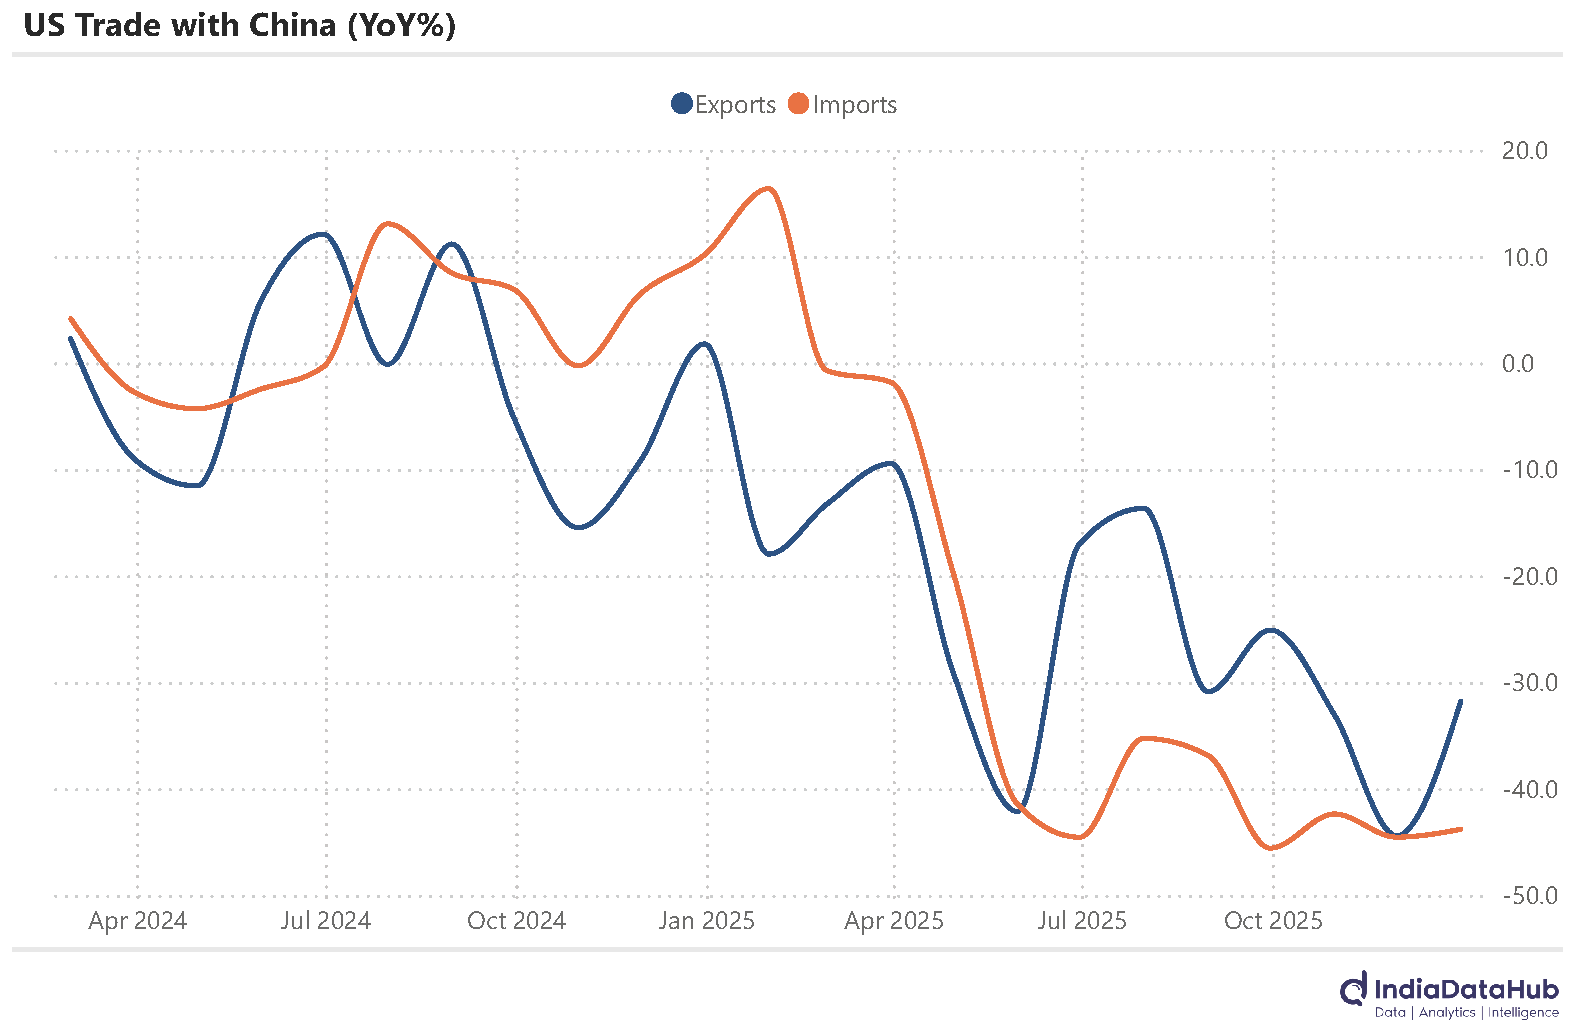
U.S. exports to China declined for the twelfth consecutive month on a YoY basis. Similarly, imports from China fell for the eleventh consecutive month. China’s share of total U.S. imports dropped sharply to 7.5% in December 2025, down from 13.2% in December 2024.
For the full year 2025, the US recorded a goods trade deficit of $1.23 trillion, which was 2.1% higher than in 2024 despite the imposition of tariffs aimed at curbing imports. During the year, goods exports grew by 6% YoY while imports increased by 4.6%.
That’s it for this week. See you next week…