
In case you missed, we started tracking aggregate holdings of all mutual funds. Updated every month, this data allows you to view the aggregate holdings of all the schemes aggregated either at an AMC level separately by the status of the schemes - active or passive schemes or combined - as well as by scheme category - small cap equity funds or value funds or liquid funds and so on. The data is accessible through web as well as through our APIs and will get shortly rolled out through our Excel Plugin. You can see a quick demo from this videoIn this edition of This Week In Data we discuss:
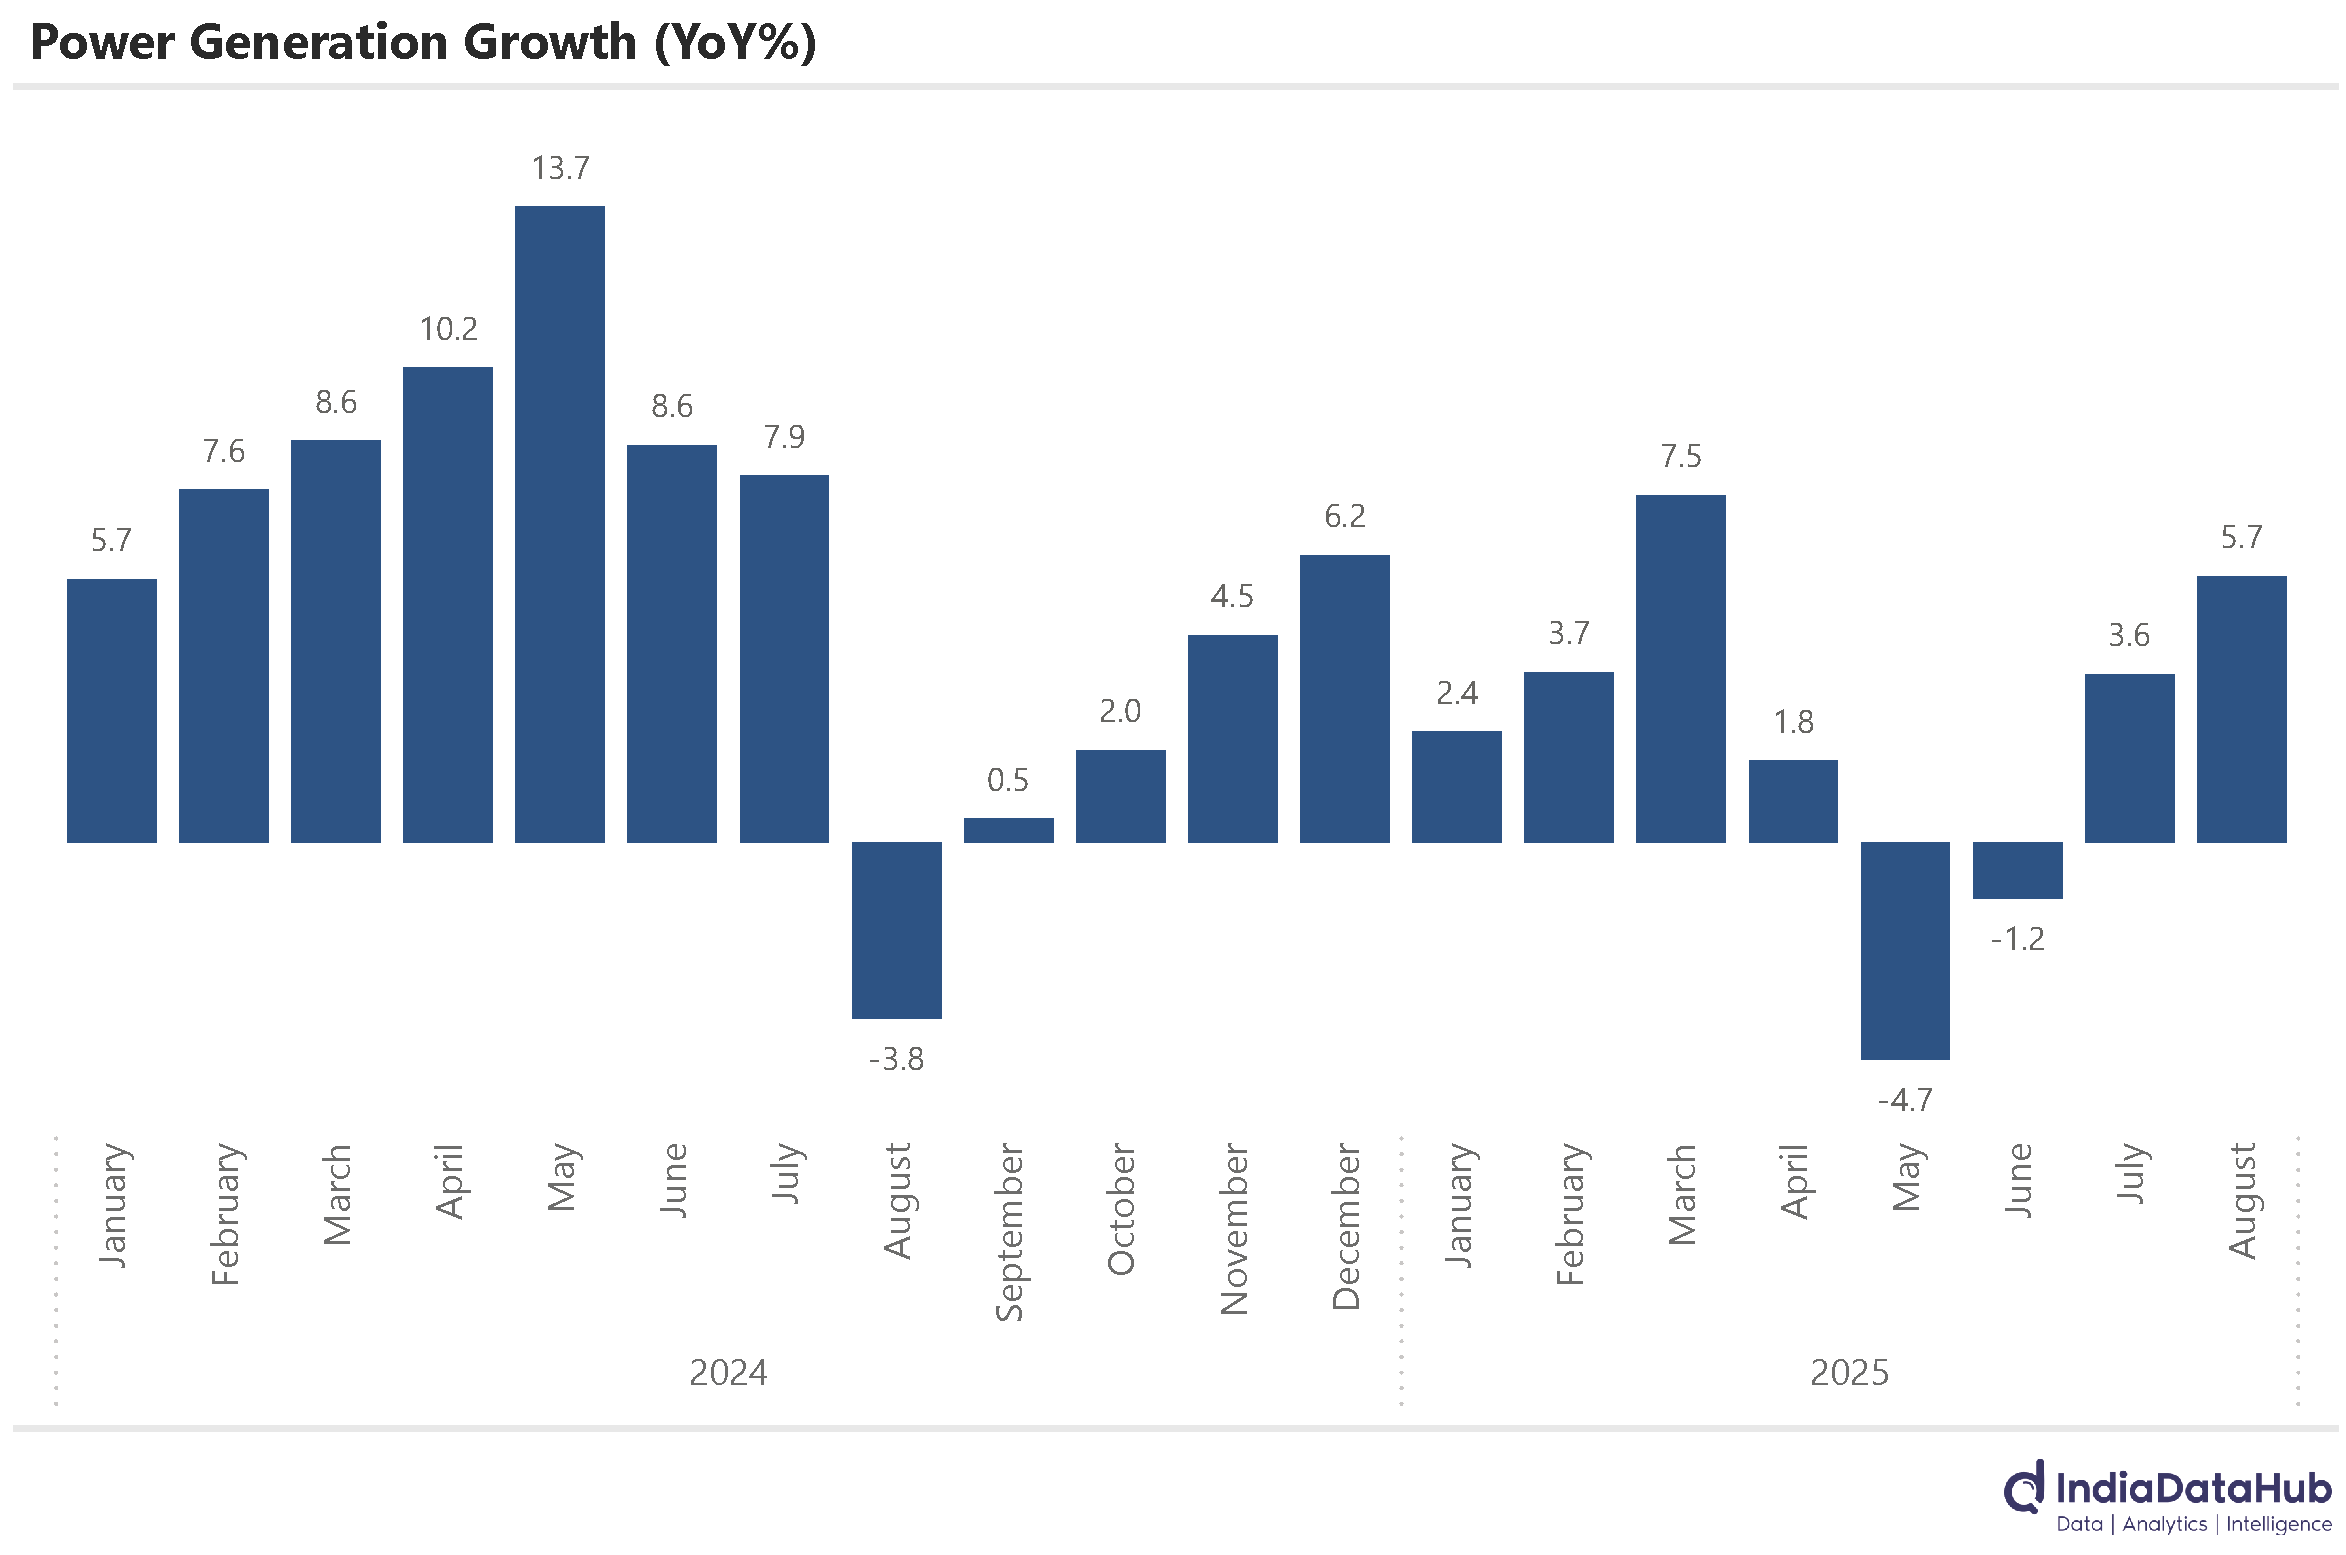
Power generation recovered in August and saw mid-single digit growth driven largely by renewable sources
Renewable sources continue to gain share in power generation driven largely by Solar which has seen manifold increase in capacity as well as generation
August was a better month for Automobile sales especially for Tractors, Trucks and Buses. Car sales saw muted growth.
Domestic aviation is seeing a slowdown even adjusted for the troubles at SpiceJet.
Euro area inflation ticked up slightly in July but Korea, Turkey and Thailand continue to see moderation in Inflation
US labour market has softened considerably in August and markets are now expecting aggressive monetary easing from the Fed
Power generation grew by 5.7% YoY in August as per the provisional data. This is the highest growth since March. However, the average growth in the last 3 months remains modest at just 2.7% YoY. And even in the preceding 3-month period (Mar-May), growth in power generation was a modest 1.5%. So, month-to-month variability in the data aside, the big picture still continues to remain that of subdued growth in power generation and, by implication, consumption.
Renewable sources continue to see strong growth in generation. The last 3 months have seen renewable power generation grow by almost 30% whereas conventional sources have seen power generation remain stagnant or even decline. Consequently, renewable sources now account for 19% of the total power generated in the country (last 3-month average). A year back, renewable sources accounted for just 15% of the power generated.
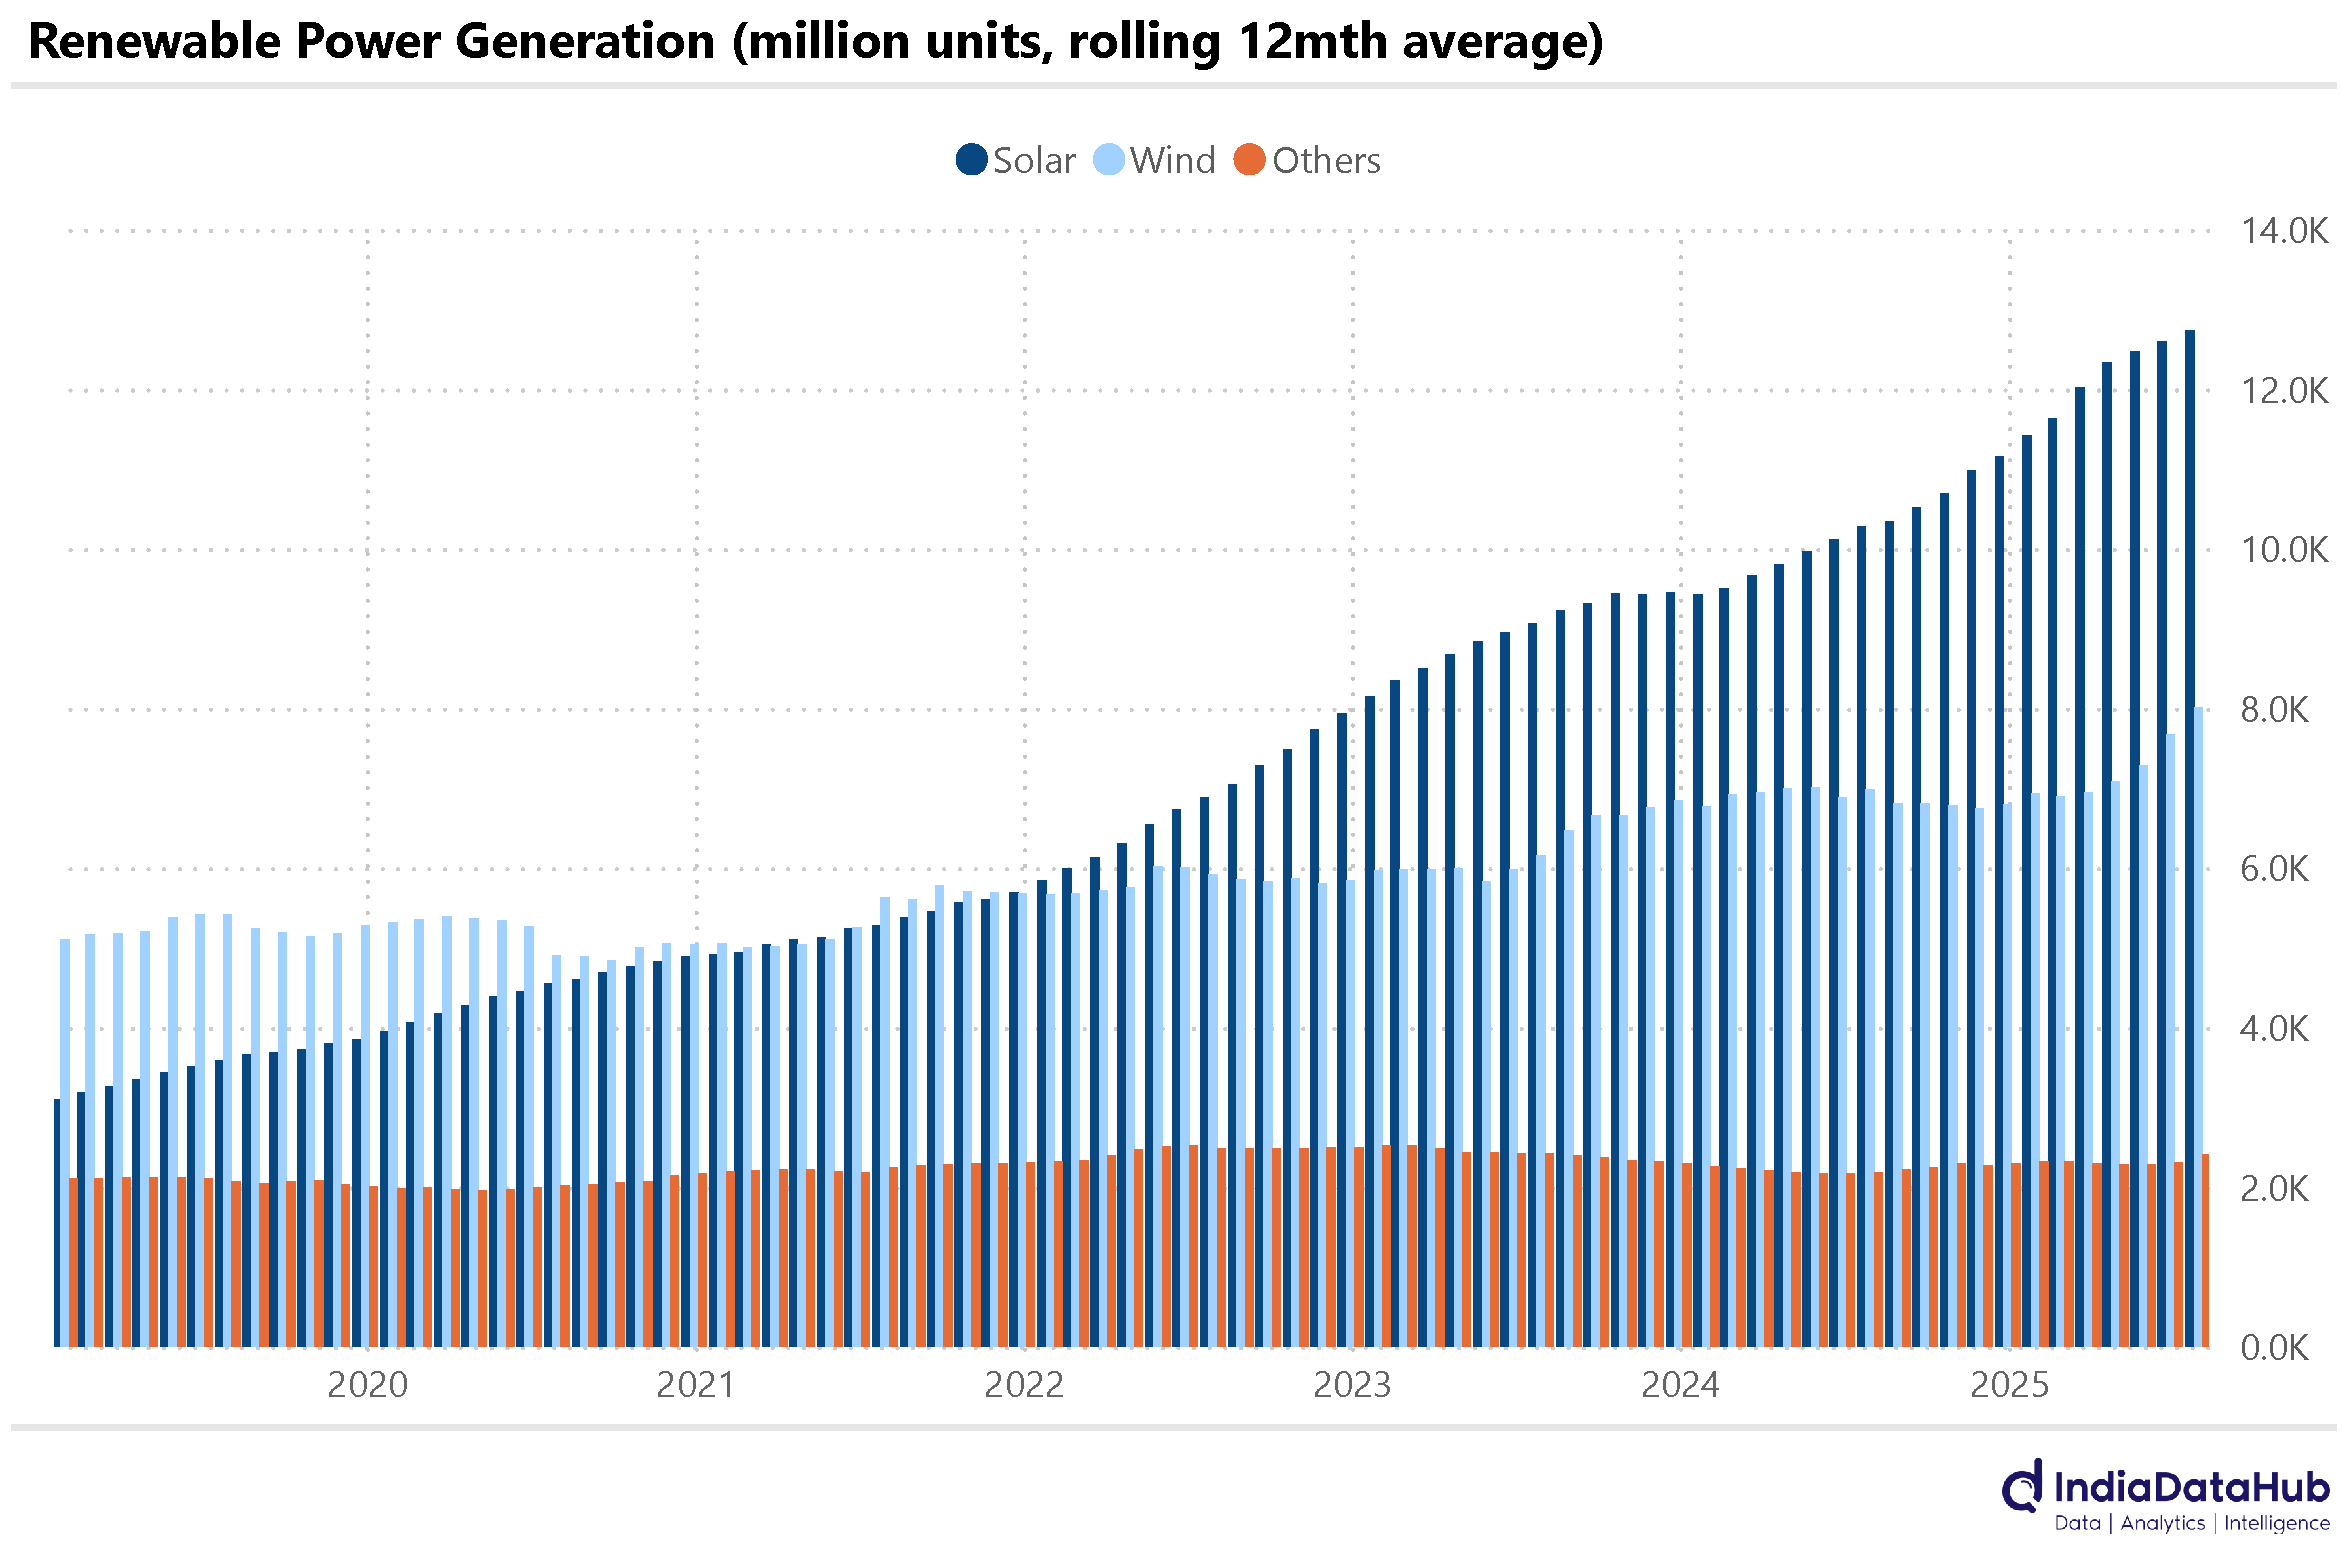
And within renewable sources, solar power continues to grow faster than other modes of generation. In the last 12 months (data till July), Solar accounted for 55% of renewable power generated, up from 53% in the preceding 12-month period. The share of wind has fallen by over 1ppt during this period, as has that of other renewable sources. And this is part of the longer-term trend. In FY20, for instance, solar power was just 36% of renewable power generation while wind accounted for 47% of total renewable power generated in the country. This increase in solar generation, not surprisingly, reflects higher capacity additions. Over the past 5 years, while solar capacity in the country has increased by almost 3.5x, that of wind has increased by less than 50%.
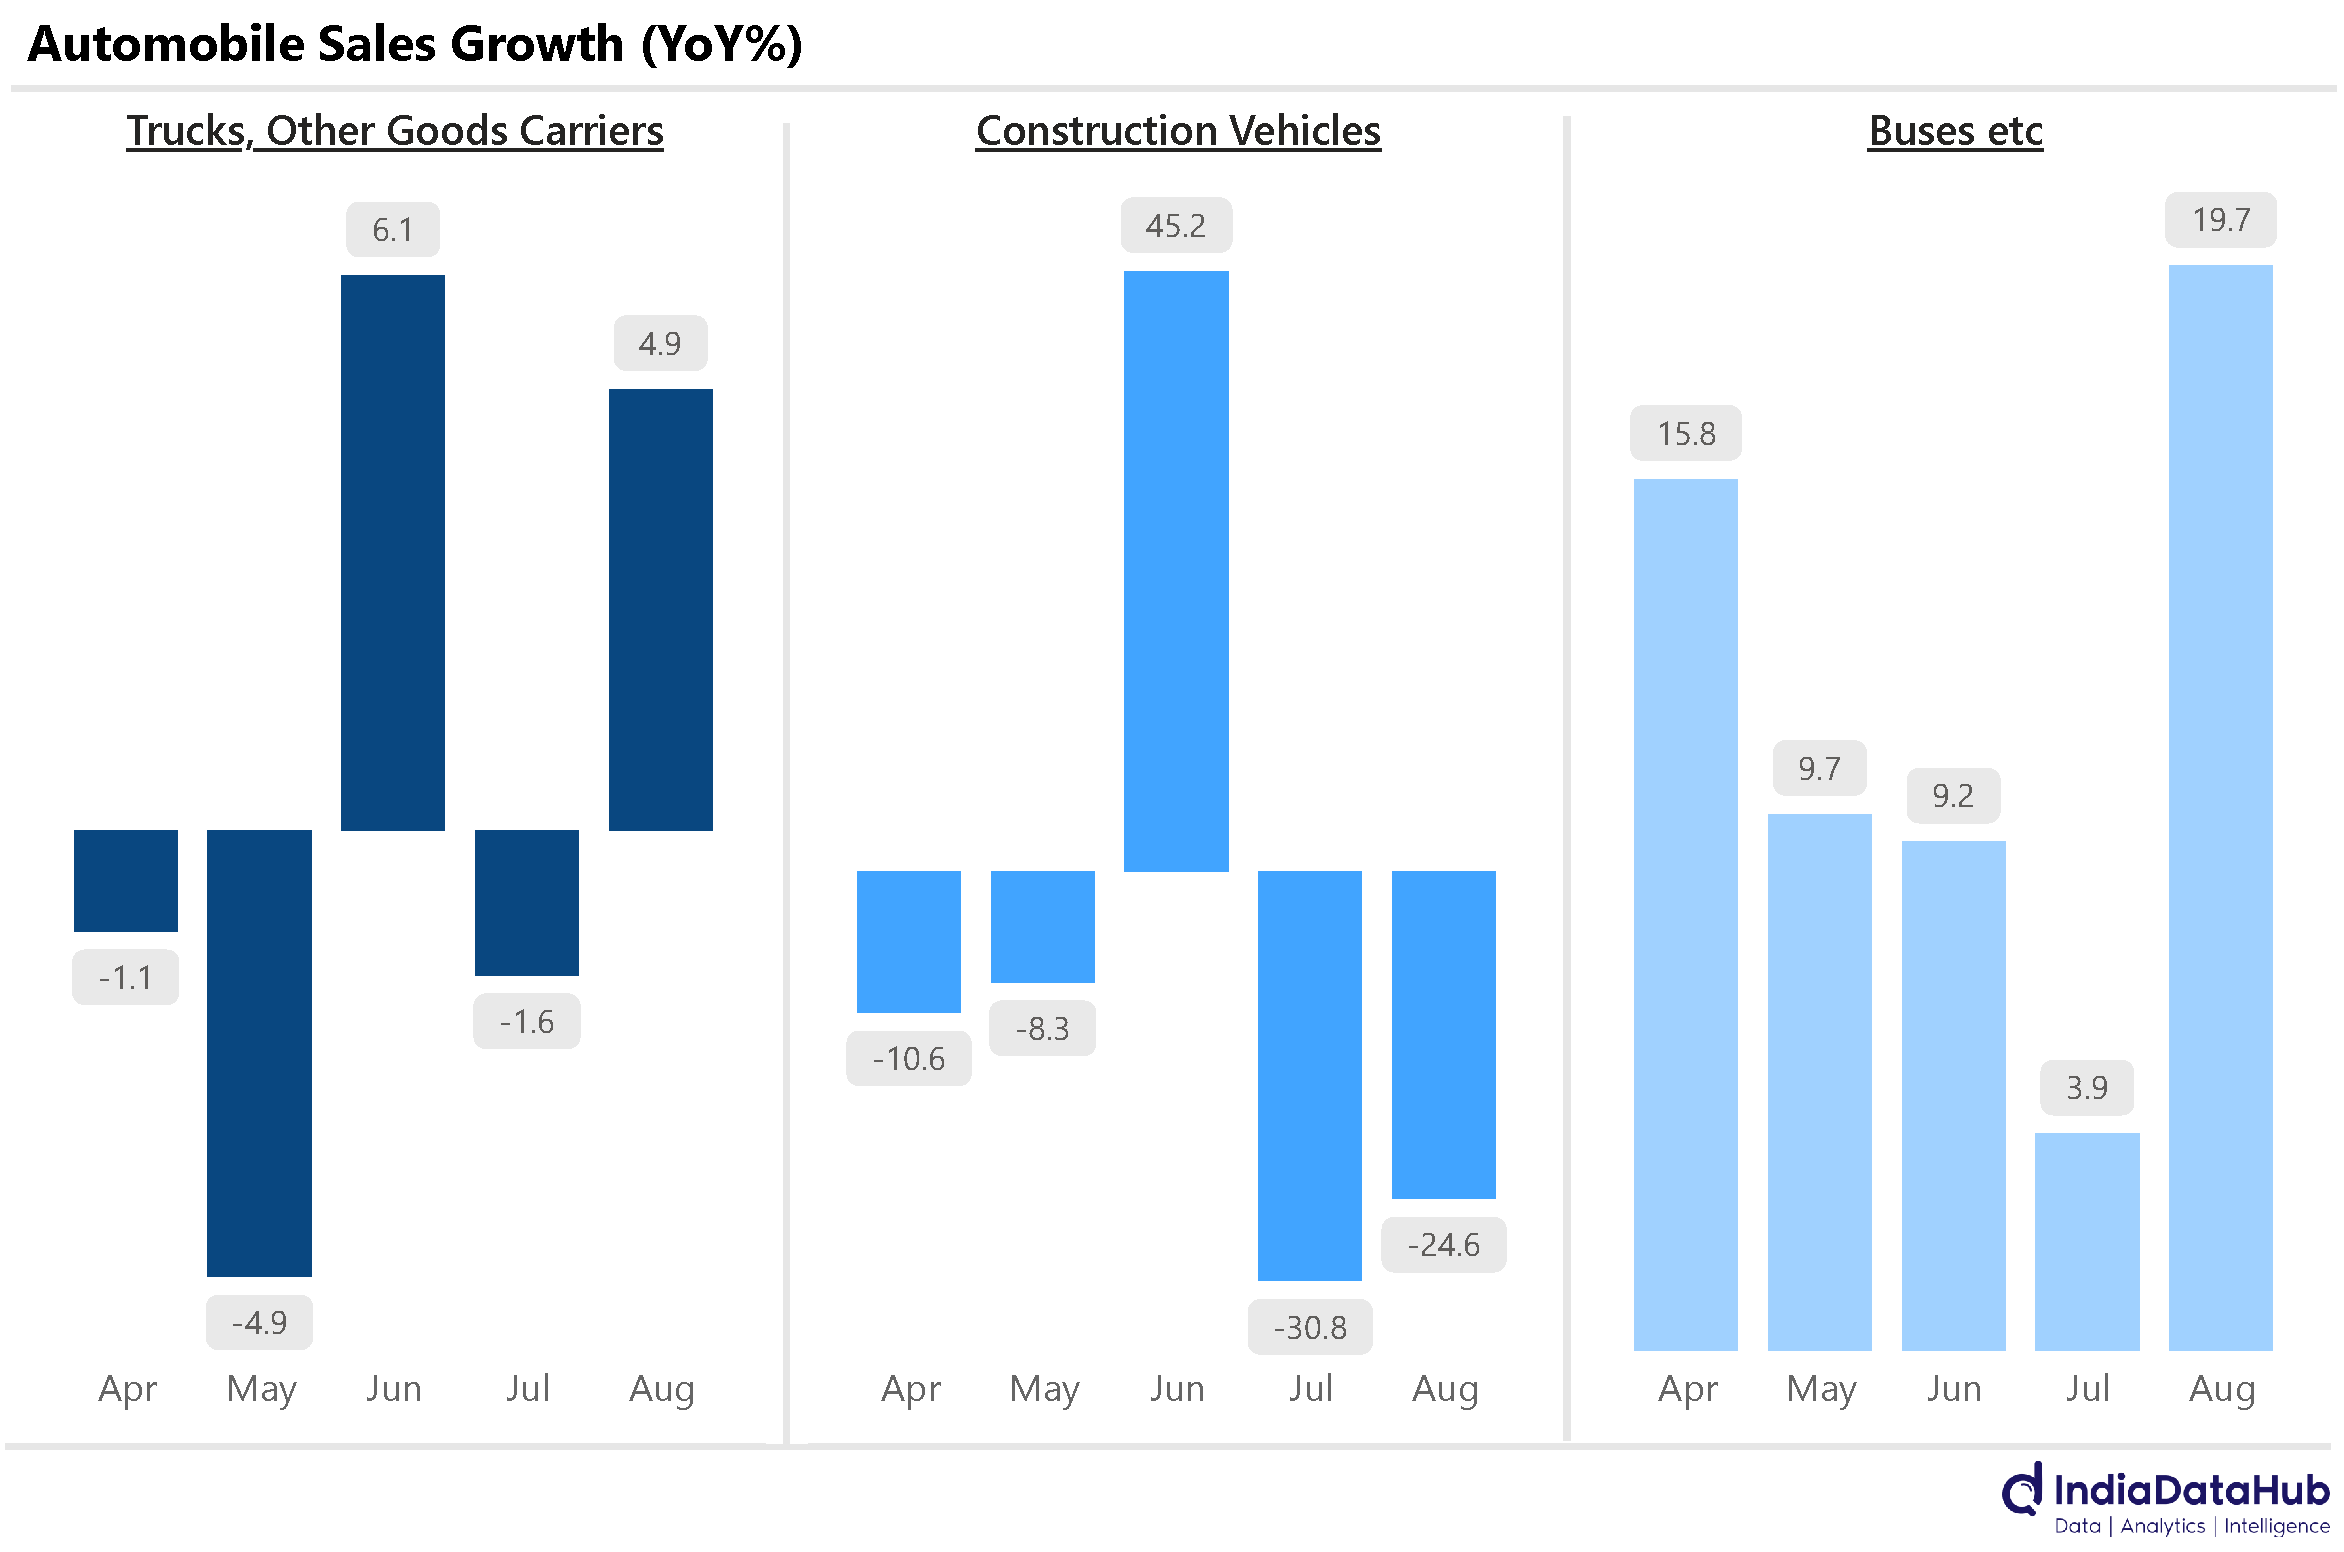
Like with power generation, the automobile sector also saw a recovery in sales in August. Tractors led the market, accelerating sharply from +10% YoY in July to +30% YoY in August. Trucks & Other Goods Vehicles rebounded from a -2% YoY decline in July to +5% YoY growth in August, reflecting improved logistics demand. 2Ws bounced back from a -6% YoY decline in July to +2% YoY growth in August.
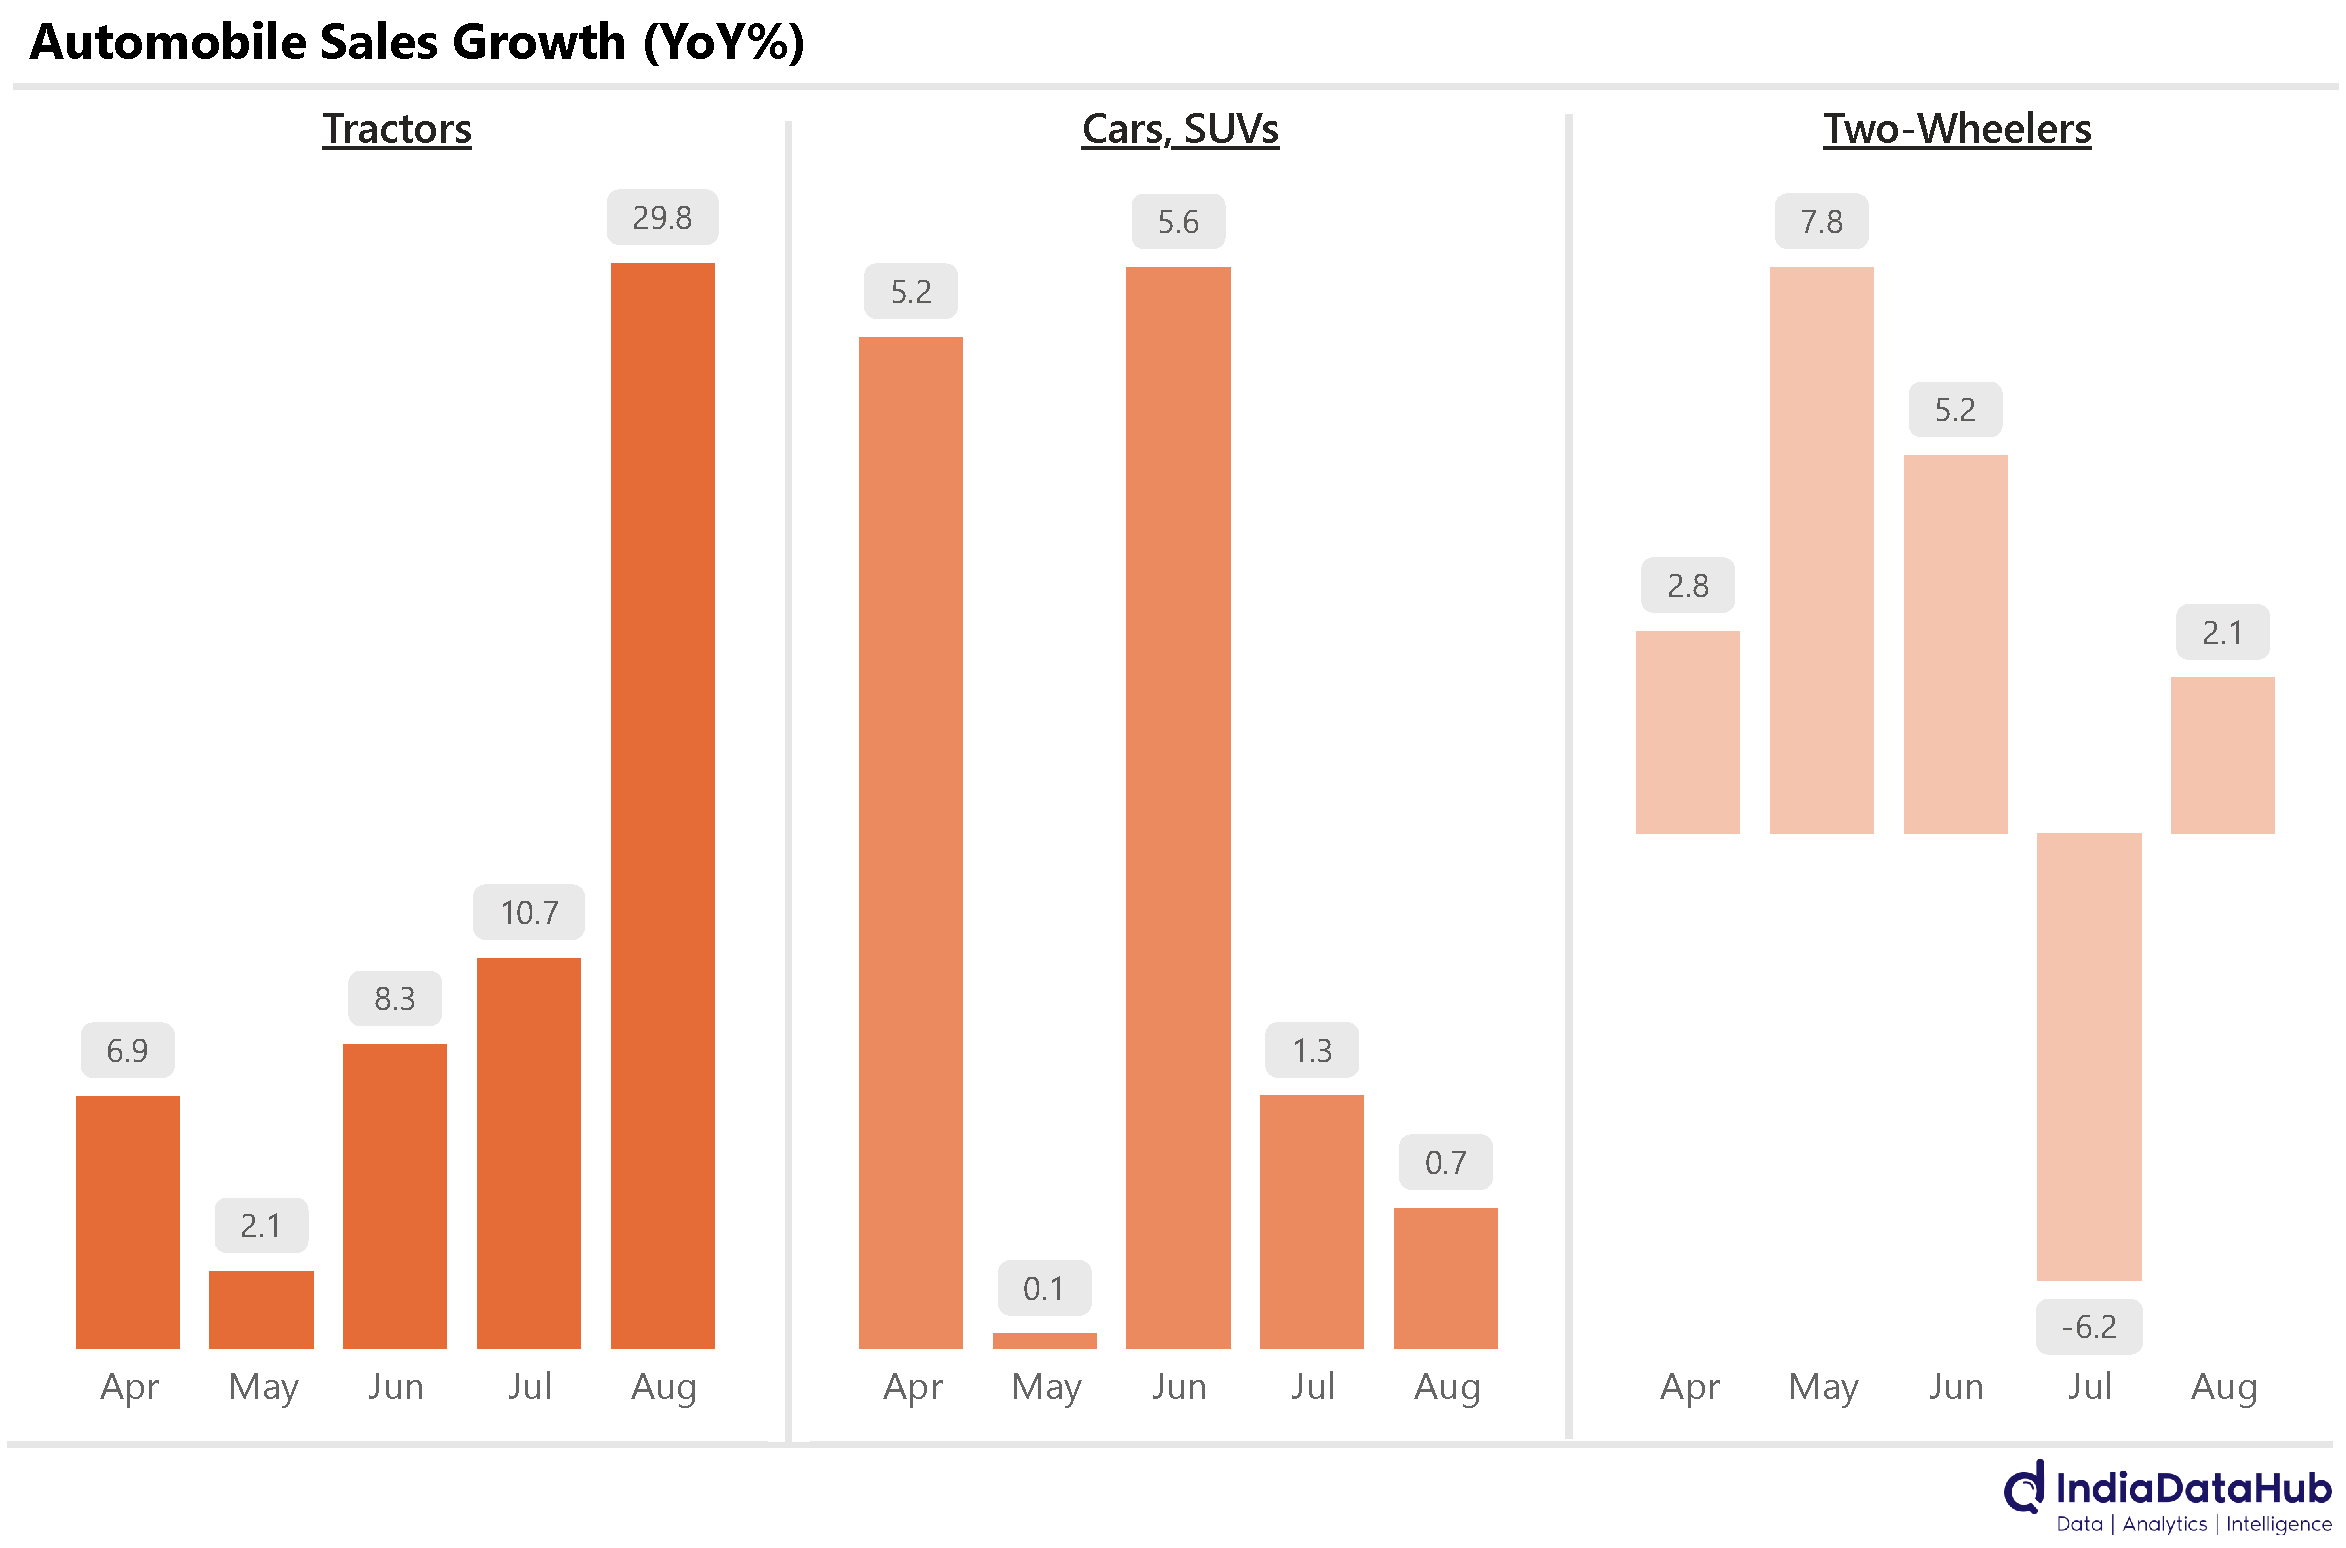
The decline in Construction Vehicles eased from -31% in July to -25% in August, indicating a mild recovery. Sales of Cars & SUVs, however, remained weak, growing less than 1% YoY. This possibly also reflects the postponement of purchases, given that the PM hinted at a reduction in GST on small cars on 15th August. That said, Passenger car sales have remained subdued for several months now – the median monthly growth in 2025 is a modest 3.3%!
Domestic Airlines had a soft July. Total passengers carried by them on domestic flights declined by 3% YoY. This is the first time passenger traffic has declined since February 2022. This is also the third consecutive month of weak growth. Domestic passenger traffic grew a modest 2% YoY in May. But this weak growth was at least in part due to the disruption caused by Operation Sindoor in many Airports in North and West India. June growth recovered to 3% YoY, and now July has seen a decline.
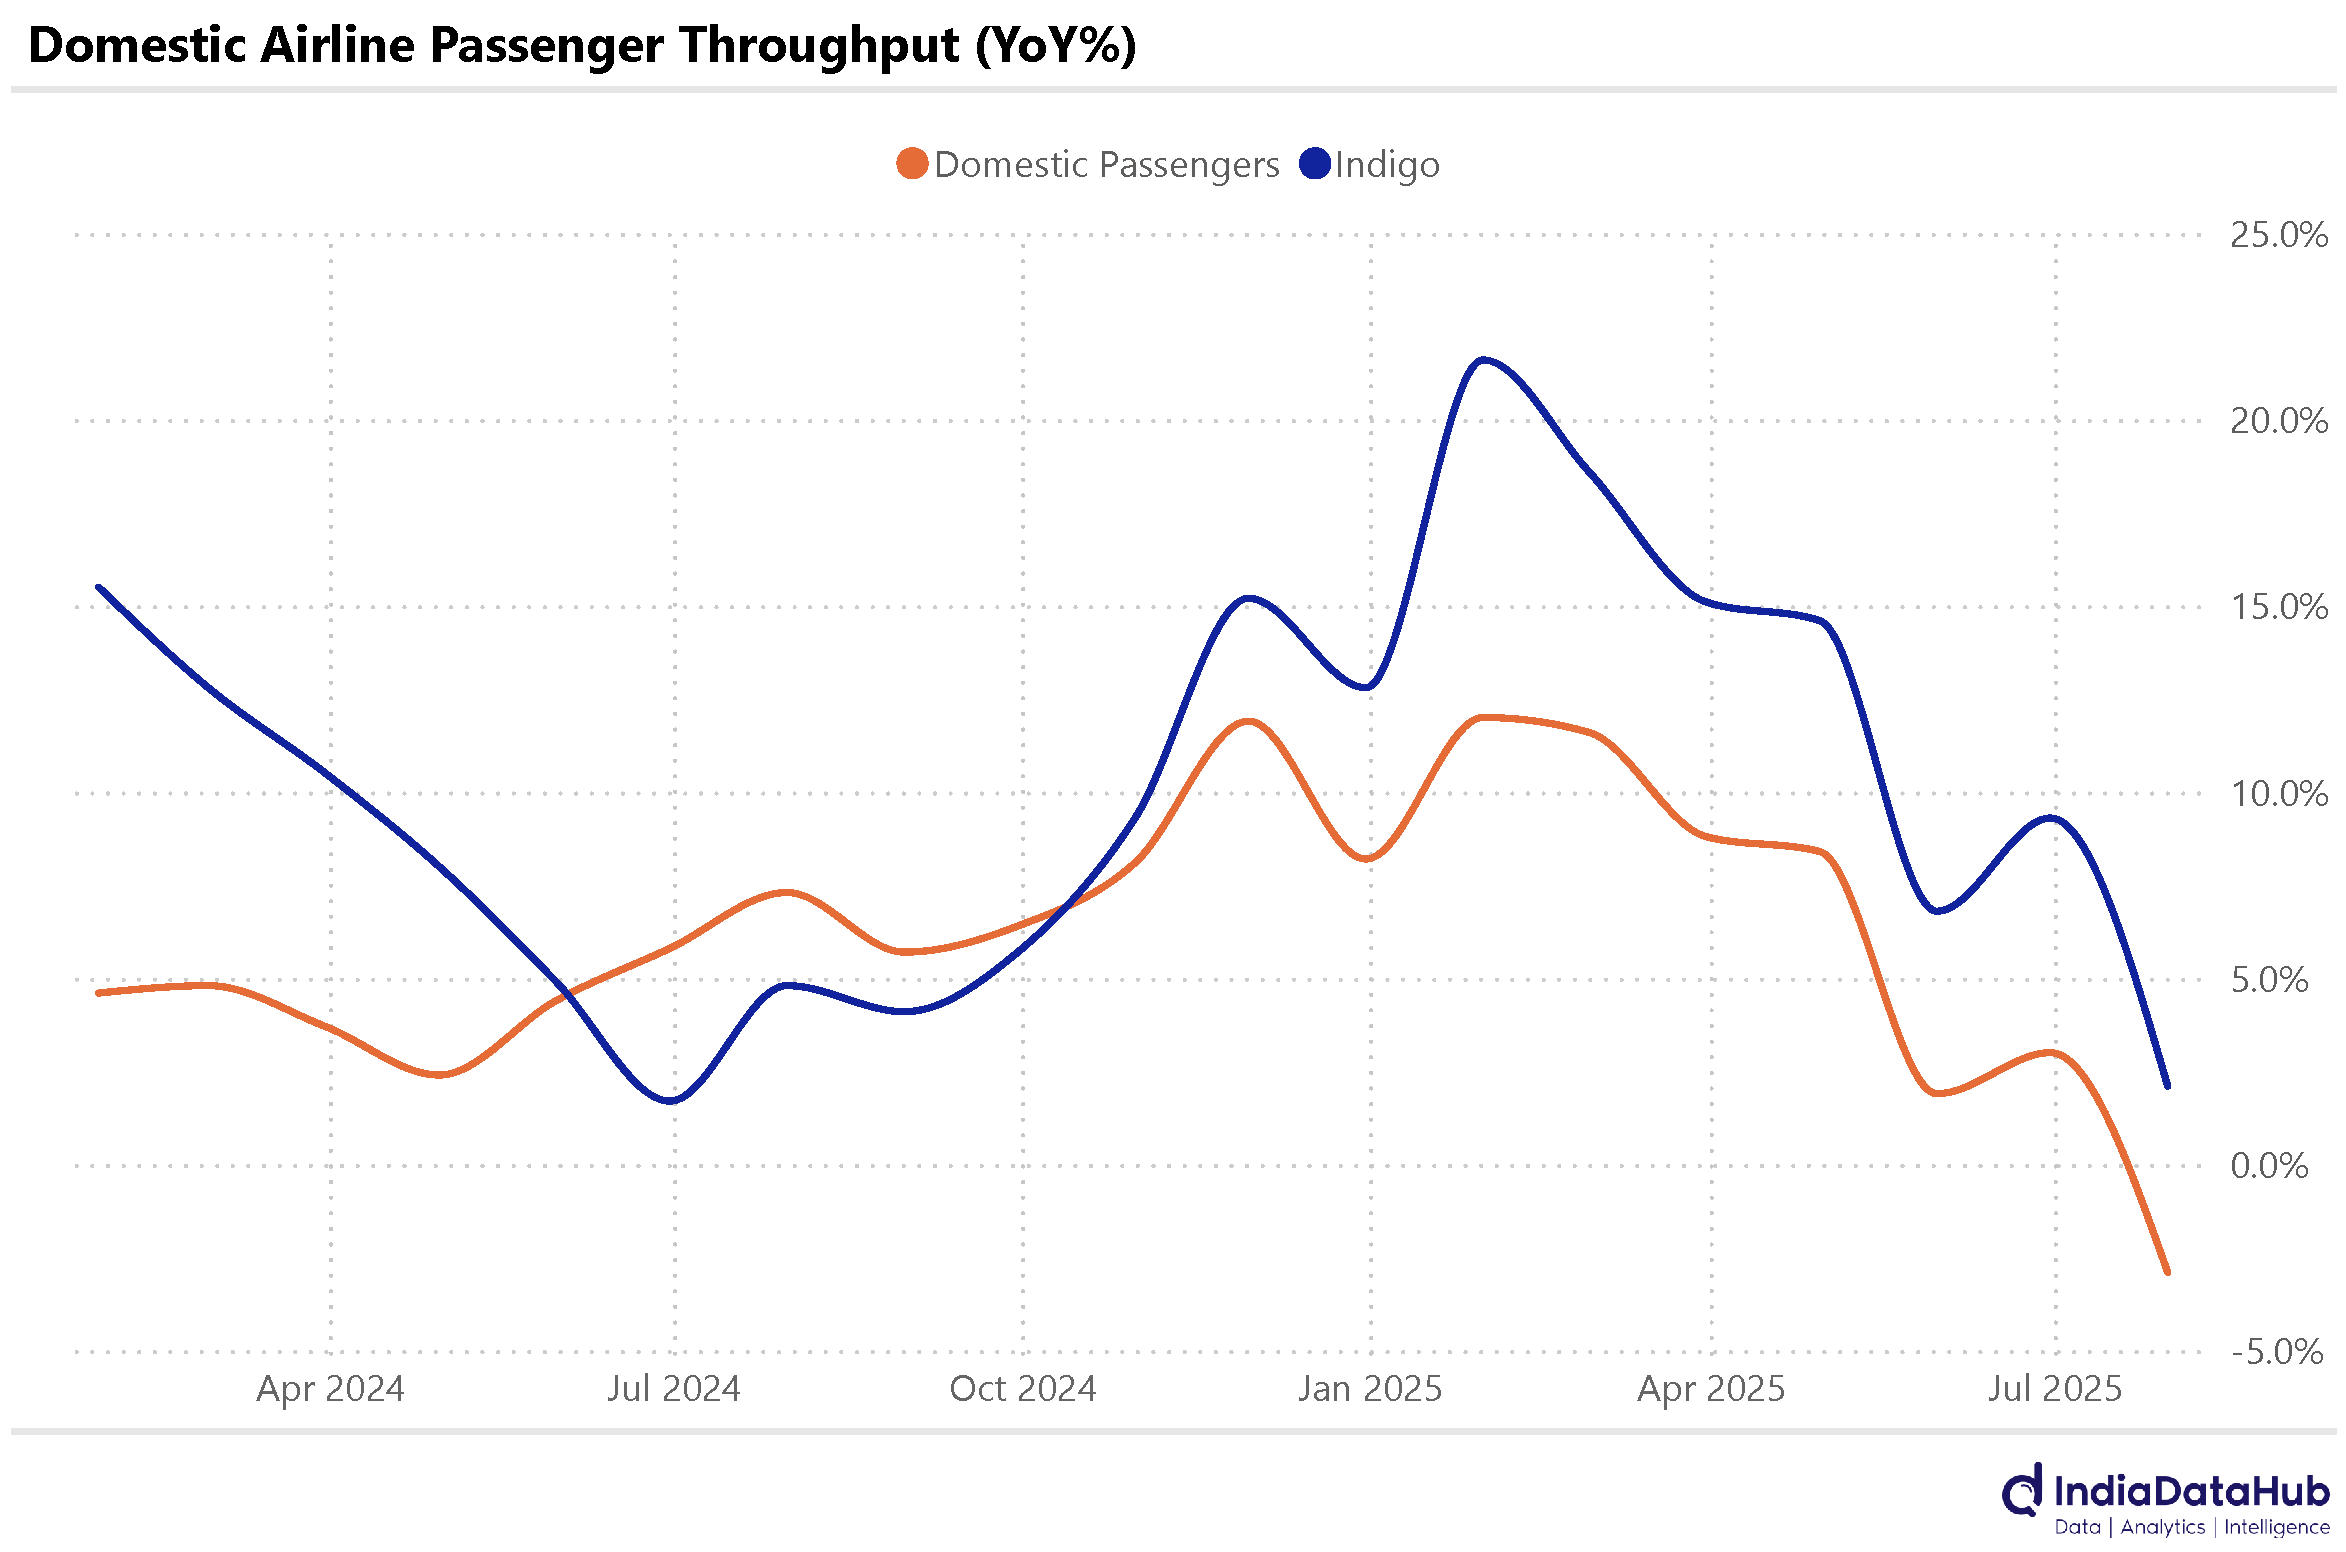
The troubles at SpiceJet are one of the drivers of this slowdown in the Industry. SpiceJet saw an almost 40% decline in passenger throughput in July. However, even excluding this, there is a slowdown - Indigo, for example, saw domestic passenger growth slow to 2% YoY in July, its slowest growth since June last year.
As an aside, what continues to fascinate us is how passenger movement has changed post-COVID. The number of passengers using the Indian Railways continues to remain well below (~10%) the pre-COVID levels. In contrast, the number of passengers using domestic airlines is now well above (~20%) the pre-COVID levels. What gives? Is this a reflection of people switching to automobiles or upgrading to airlines, reflecting better regional connectivity or a large section of people simply reducing their travel or something else?
Globally, this week began with the release of inflation data from several major economies. In the Euro Area, Eurostat published its flash estimate showing that the Harmonised Index of Consumer Prices (HICP) rose by 2.1% year-on-year in August, slightly above the 2% recorded in the previous two months.
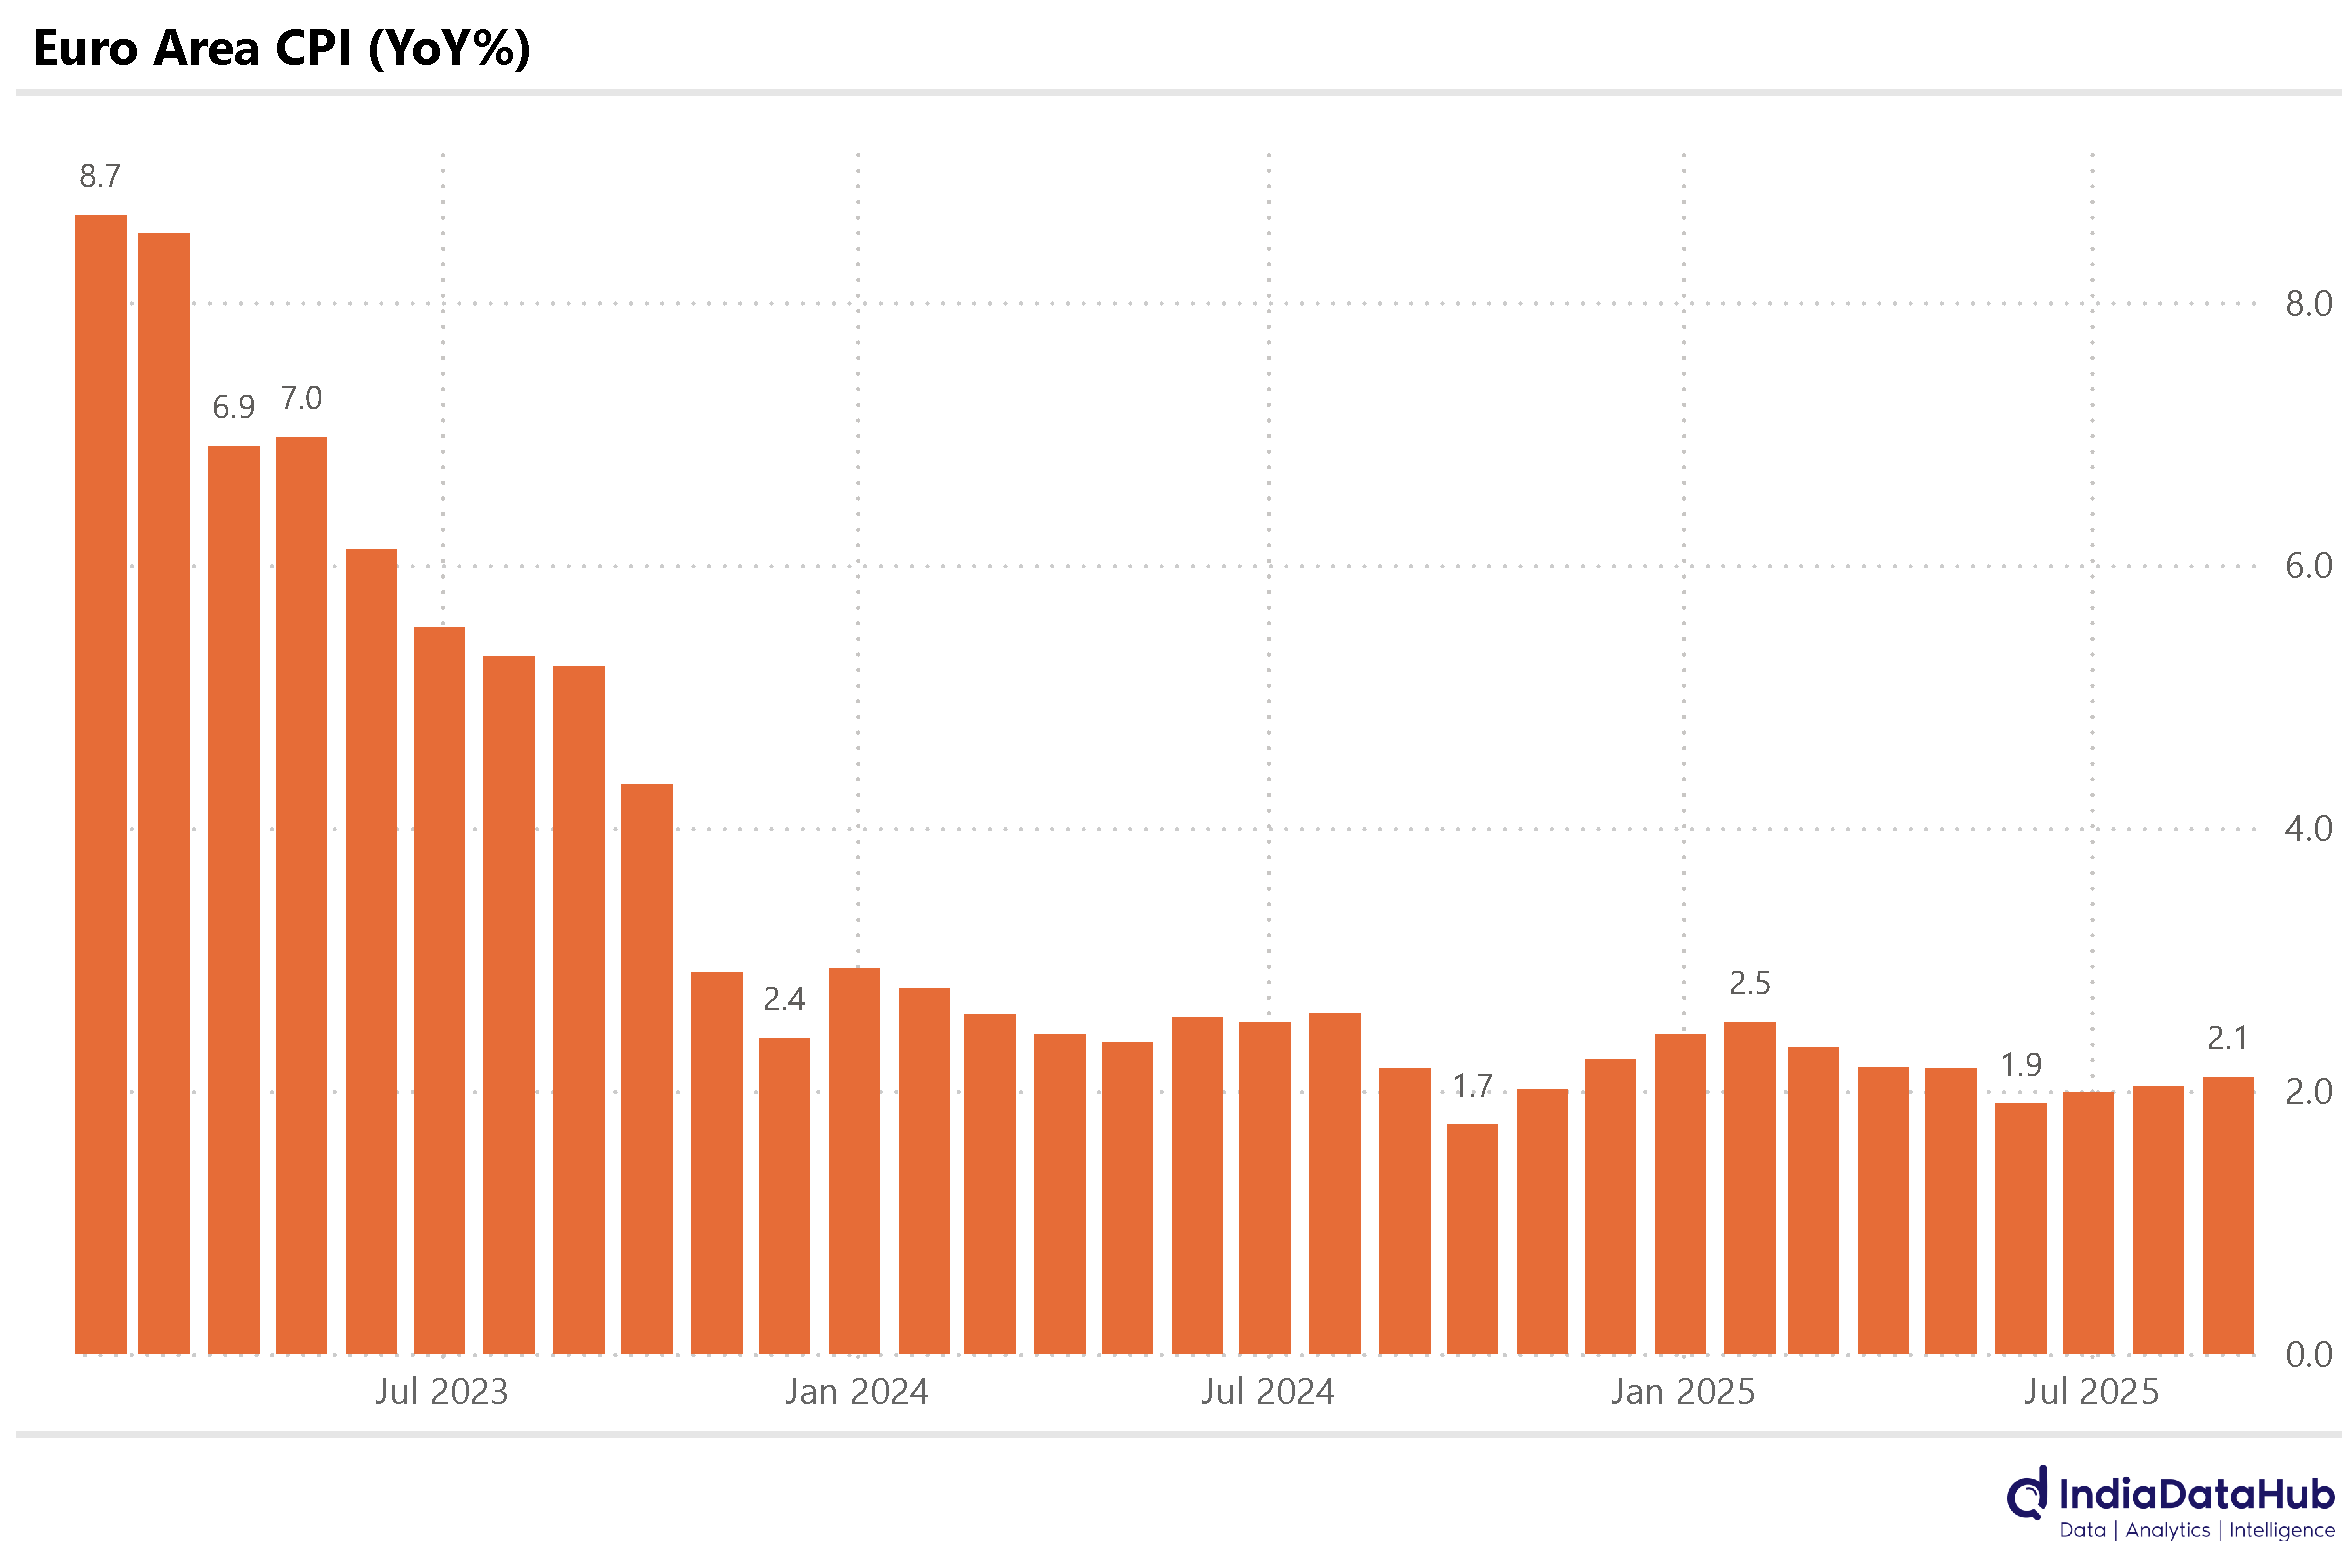
Among member countries, Estonia reported the highest HICP at 6.2%, followed by Croatia at 4.6%. In South Korea, inflation eased from 2.1% in July to 1.7% in August, marking the lowest rate in nine months. Meanwhile, Turkey saw a sharp decline in inflation from 52% in August 2024 to 33% in August 2025, the lowest rate recorded since November 2021. Thailand, on the other hand, experienced deflation for the fifth consecutive month, with consumer prices falling by 0.8% year-on-year in August.
In the United States, the Bureau of Labour Statistics (BLS) released the non-farm payroll data. The U.S. economy added just 22,000 jobs in August, significantly below market expectations. Furthermore, in aggregate, the job figures for the previous two months were revised down modestly - June’s employment change was adjusted downward by 27,000 to -13,000, while July’s figure was revised upward by 6,000 to 79,000.
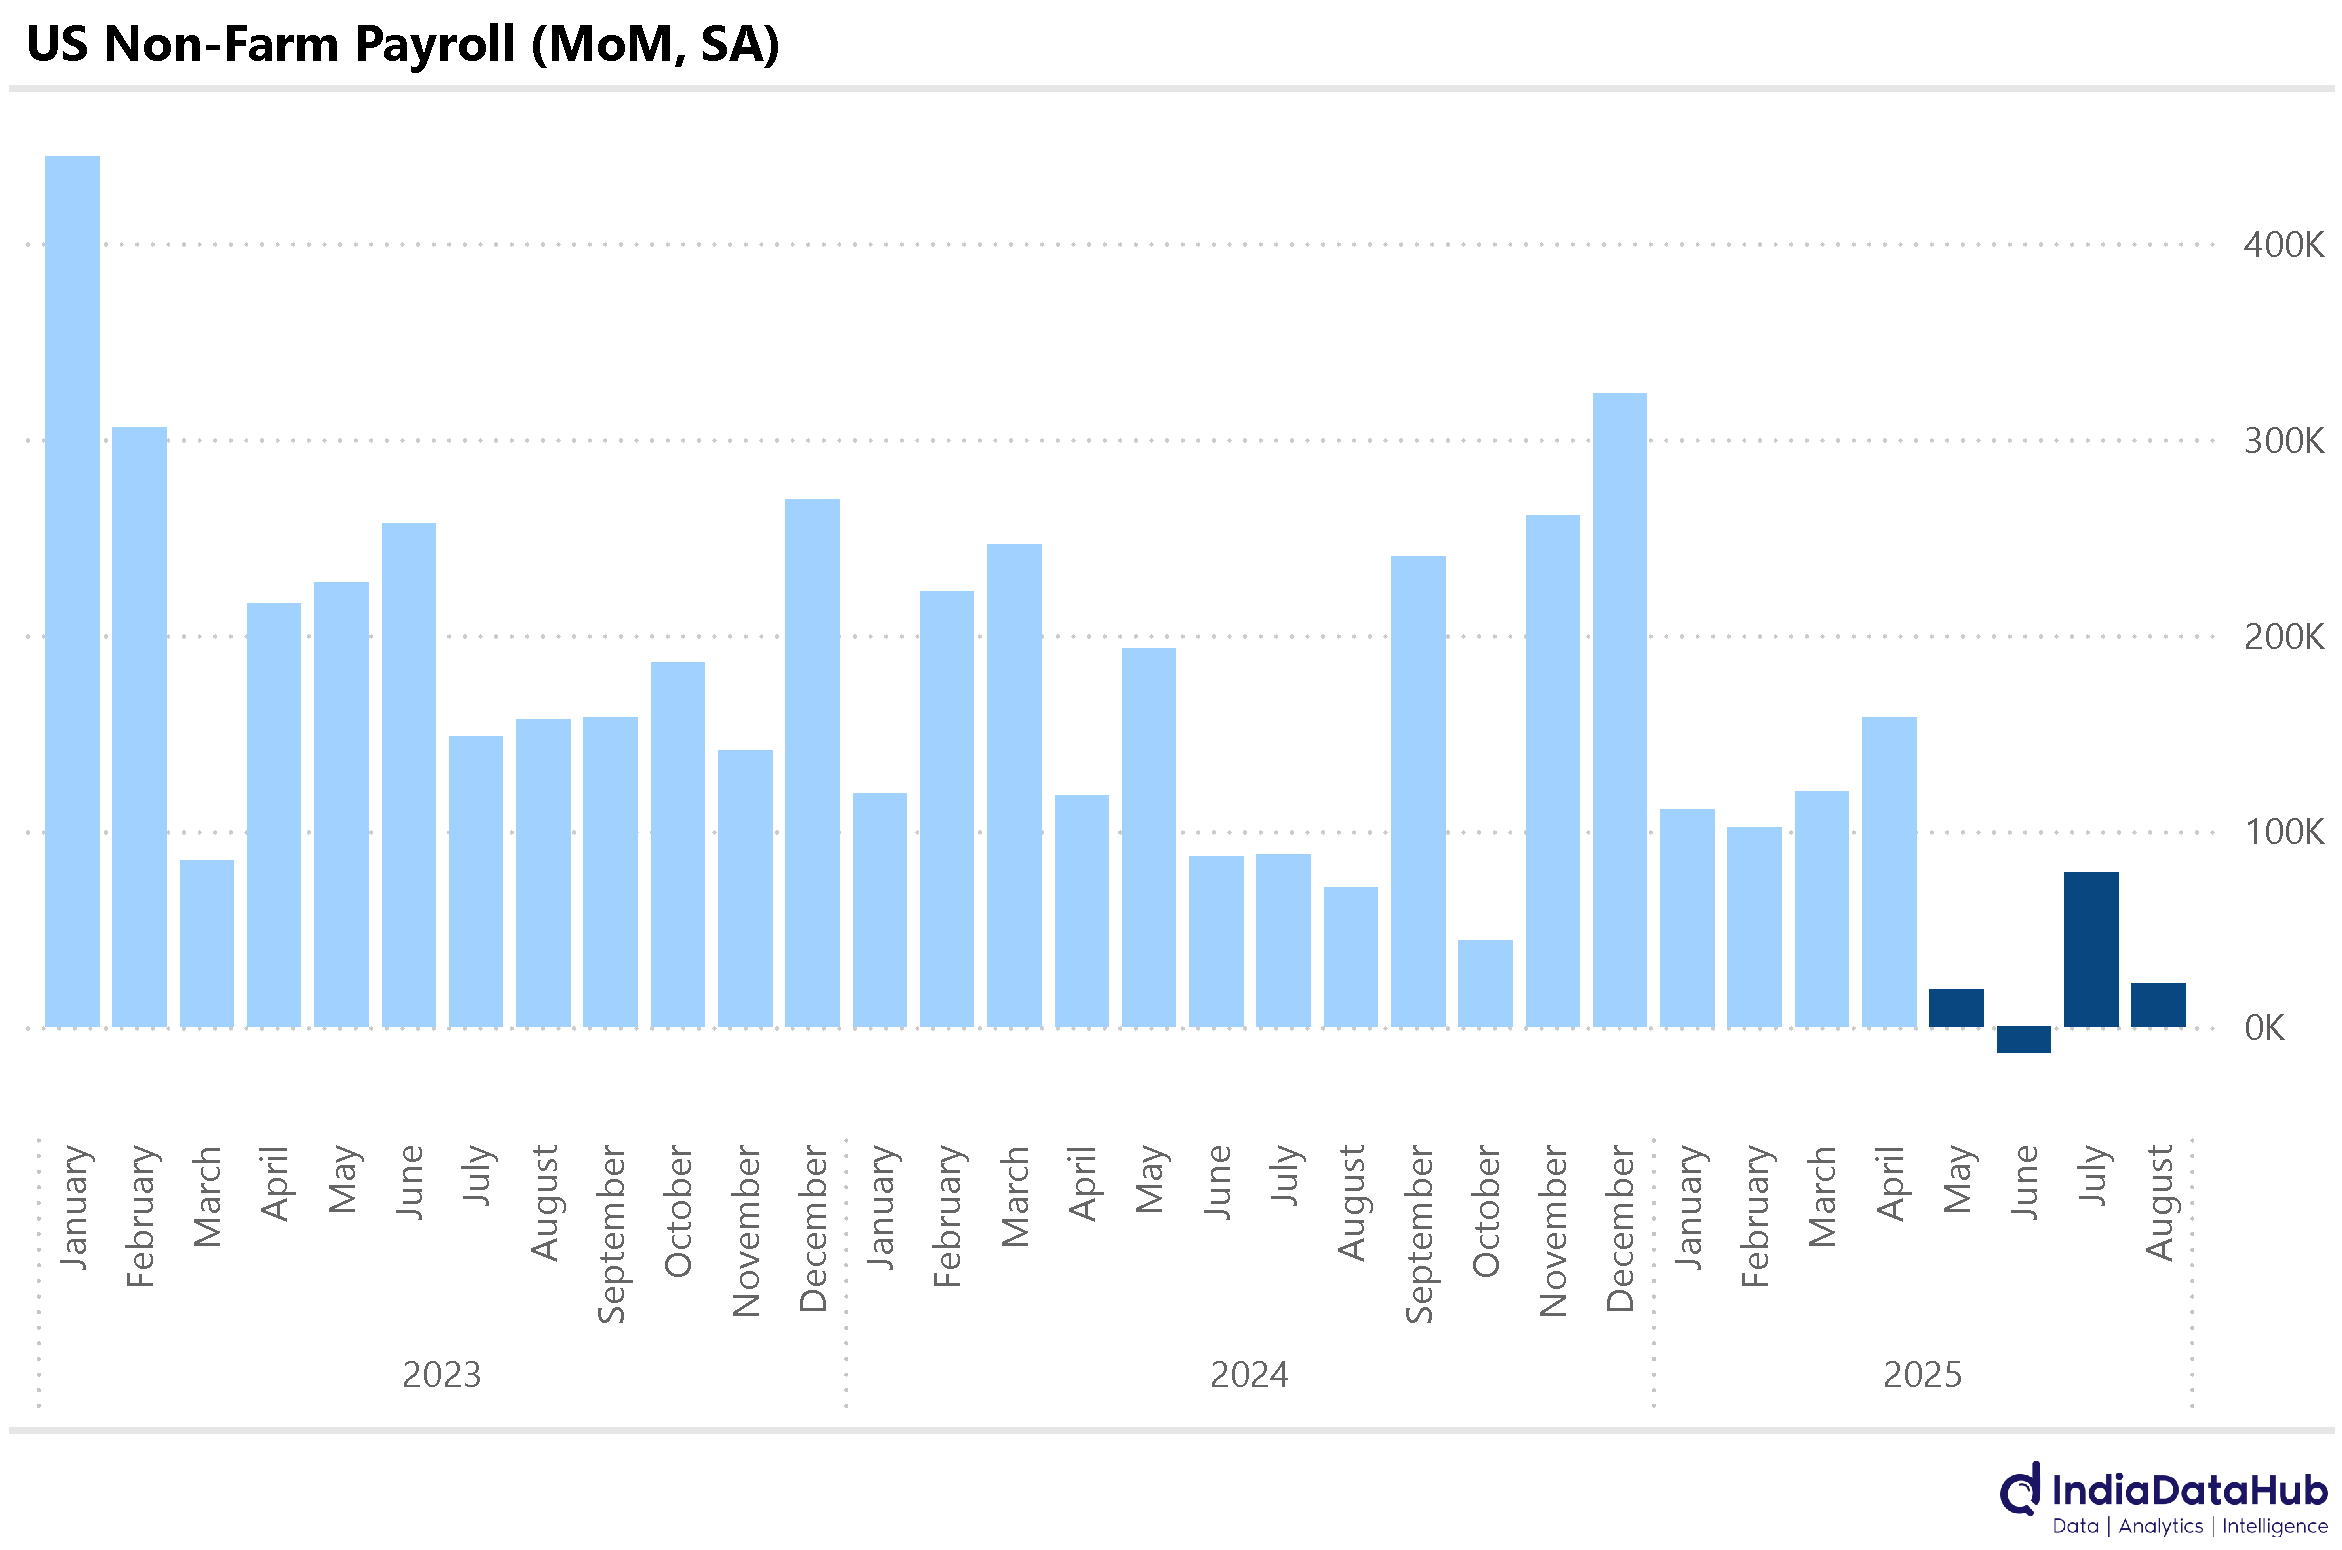
On balance, the US labour market seems to have taken a step down with job growth practically stalling in the last few months. The last 4 months for instance have seen a job growth of just over 100k whereas in the preceding 4 months the US economy had added almost 500k jobs. Not surprisingly, markets are now firmly in the Fed rate cut camp. The implied probability of a rate cut later this month has risen to 100%! And there is now a greater than 70% probability, based on Fed Fund Futures, of three rate cuts from the Fed before the end of the year…
That’s it for now. See you next week…
Thanks for the newsletter. I had one question - what is the data source for the monthly power generation numbers in the first two charts? Thanks in advance.