RBI Rate Increase, Strong growth in EWay bills, Uptick in Port traffic, MF Flows and more...
This Week In Data #5
In this edition of This Week In Data we cover
Review of RBI’s policy rate decision
Round up of key high frequency data released during the week
Mutual Fund Inflows
We have significantly expanded our coverage of Mutual Fund data in the last couple of weeks. We now track MF data across distributor channels (such as direct plans) as well as across all the states. AUM by different investor categories as well as by its aging. This data is available across different categories of schemes for the entire industry. Data for individual AMC is on the way. And all of this will soon get presented through a neat, interactive dashboard on the site!So as expected the RBI raised the policy repo rate by 25bps this week. The repo rate now stands at 6.5%. The repo rate was last at this level in early 2019. So, the first point to note is that we have retraced not just the Covid period rate cuts but much more – for reference, in February 2020 when Covid hit, the repo rate was 5.15%.
Now, the general expectation was for the RBI to tone down its guidance and suggest that there may not be any further rate hikes. However, that has not happened. The forward guidance (reproduced below) has remained unchanged from the December policy statement. And the December guidance was unchanged from the prior meeting. Effectively, the forward guidance has remained unchanged from April last year. So, this means, unless the data changes materially for the positive, there is at least 1 more rate hike likely from the RBI.
“The MPC also decided to remain focused on withdrawal of accommodation to ensure that inflation remains within the target going forward, while supporting growth.”
The only change is that between April and September last year, the MPC’s forward guidance was unanimous (all six members voting for it), but in December and this week there were two (of the three external members) dissented. Between December and February, there has thus been no meeting of minds between the hawks and the doves on the MPC.
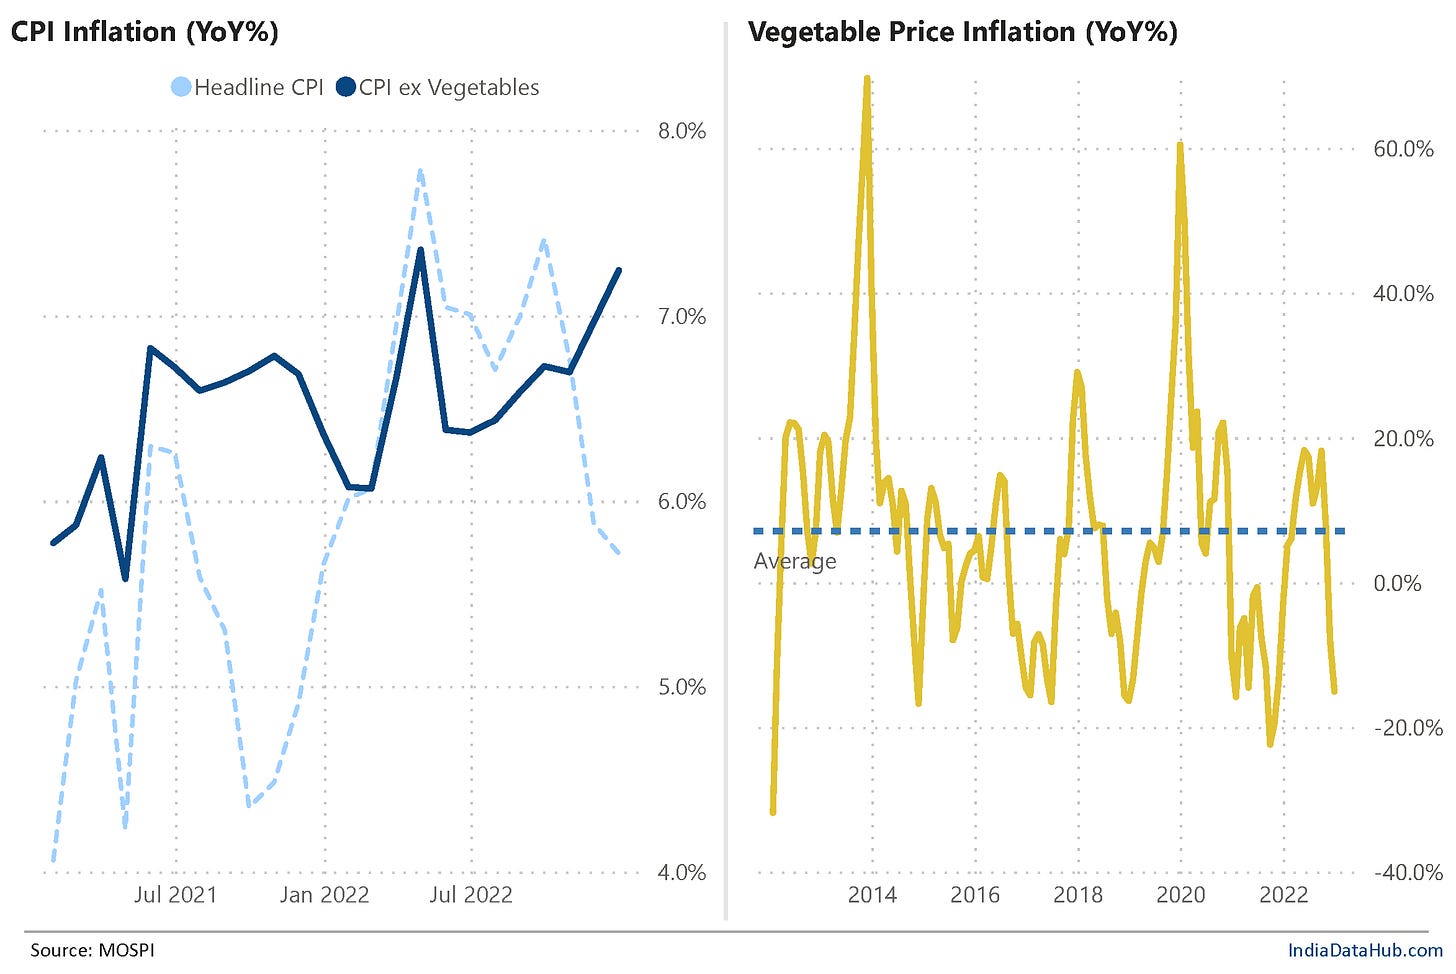
As we have been saying in our monthly Inflation report, the fall in inflation in recent months is only due to the decline in Vegetable prices. And Vegetables’ is the most volatile component of CPI as the chart above shows. In a manner of months, it can swing from +20% to -20% and back. In just the last three months inflation in Vegetables has swung from +18% YoY in September to -15% YoY as of December. Excluding Vegetables, Inflation has increased by 50bps and is above 7%. So, the underlying inflationary pressures have not eased. They have continued to remain high. So, the RBI has rightfully ignored the decline in headline CPI.
Another factor behind the continued hawkish stance from the RBI is the US Fed. The level at which the Fed will pause its interest rate hikes has seen continuous upward revision including after the most recent Fed rate hike on 1st Feb. Until the expectation of rate hikes from the Fed stabilises, it is difficult for the RBI to signal an end to rate tightening on its own.
So, the focus once again shifts to data. We get the Jan CPI data on Monday and Feb CPI data also before the next MPC meeting in early April.
Lots of high-frequency data releases this week. And they mostly suggest strong economic activity. Consider the following:
Consumption of petroleum products grew 6% in January. This is slightly lower than the 7% growth in December. However, consumption of both Petrol and Diesel grew in double digits. The lower growth was largely due to weakness in LPG, Bitumen & Pet coke consumption.
GST EWay bills issued grew over 20% YoY in January. This is the second consecutive month of over 20% growth.
Railway freight traffic growth has slowed in recent months to low to mid-single digits. However, the growth in January at 3.8% YoY was slightly better than the 3% growth in December and the 3.2% growth in the preceding couple of months.
While exports and imports are declining, cargo traffic at the major ports expanded by double digits in January, the second consecutive month of such strong growth. Thus, while in value terms trade is declining, in volume terms it is expanding. This is the exact reverse of what was happening a few months back.
January was a good month for mutual funds. Net Inflows into equity funds totaled ₹125bn, the highest in four months. Hybrid funds also saw net inflows of ₹45bn, the second consecutive month of inflows. Hybrid funds had seen net outflows every month between June and November last year. Debt funds however continue to struggle with another month of outflows – this is not surprising given the stage of the rate cycle we are in.
SIP Inflows sequentially to a new record. SIP inflows have increased on an MoM basis in each of the last 6 months. SIP AUM now constitutes 17% of total industry AUM, up from 15% a year ago.
That’s it for this week. Next week will be relatively light on data flow but with CPI being the key focus.


