Recovering FDI, Payments stalling, Decline in US Trade and more...
This Week In Data #141
In this edition of This Week In Data, we discuss:
FDI Inflows into India continue to see a revival, but outward FDI from India is rising as well
Inflows from ECBs and NRI Deposits are sharply down this year
Rupee has fallen sharply against most currencies in recent weeks
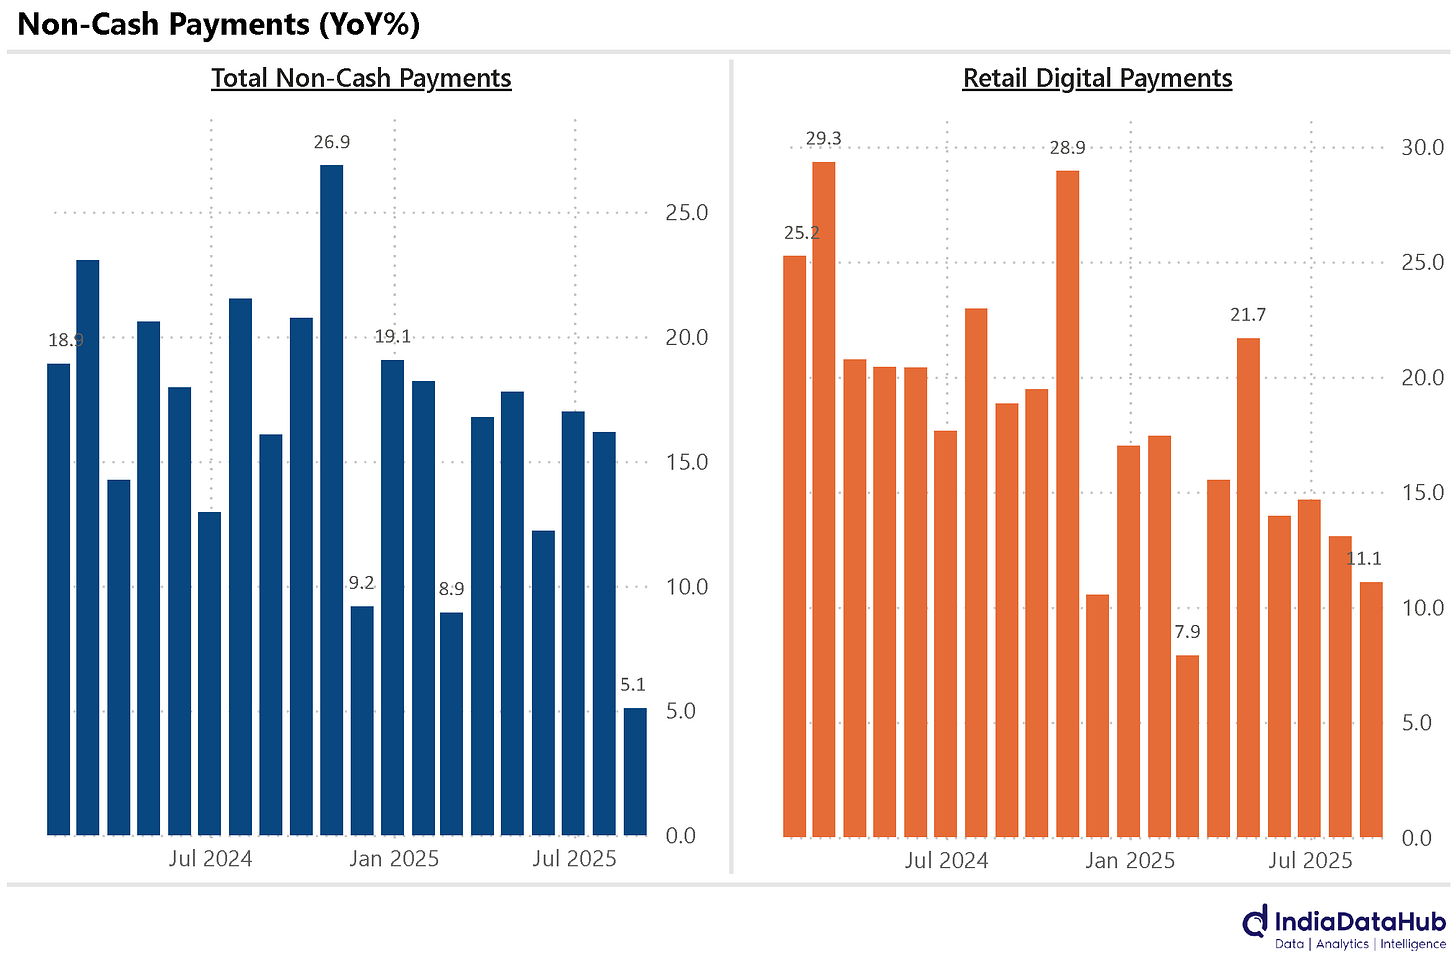
Payments growth crashed in August most likely due to GST driven disruption
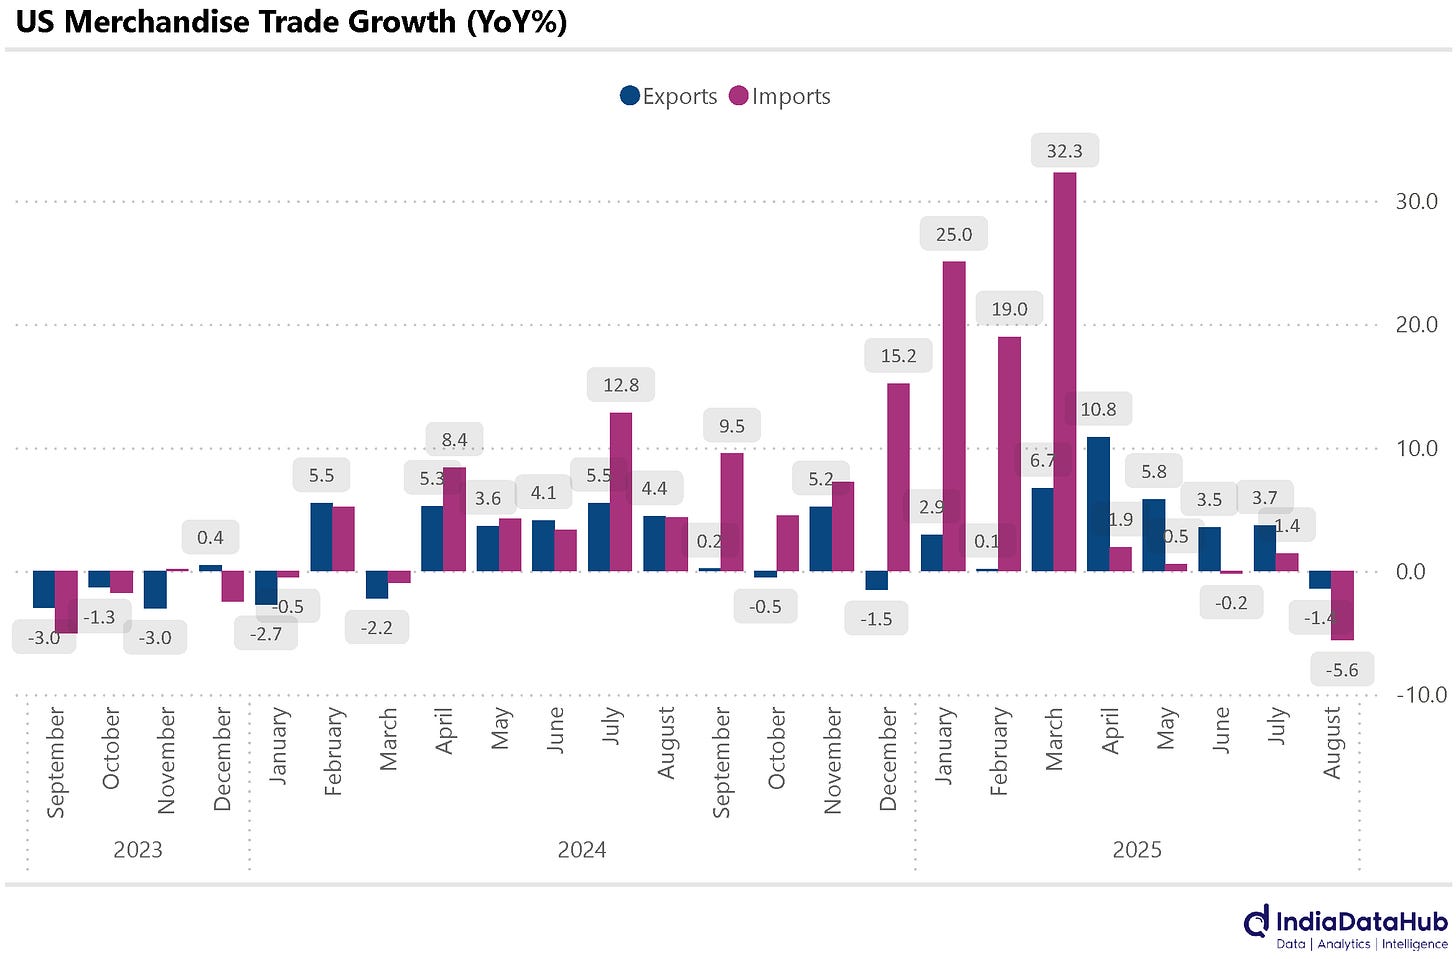
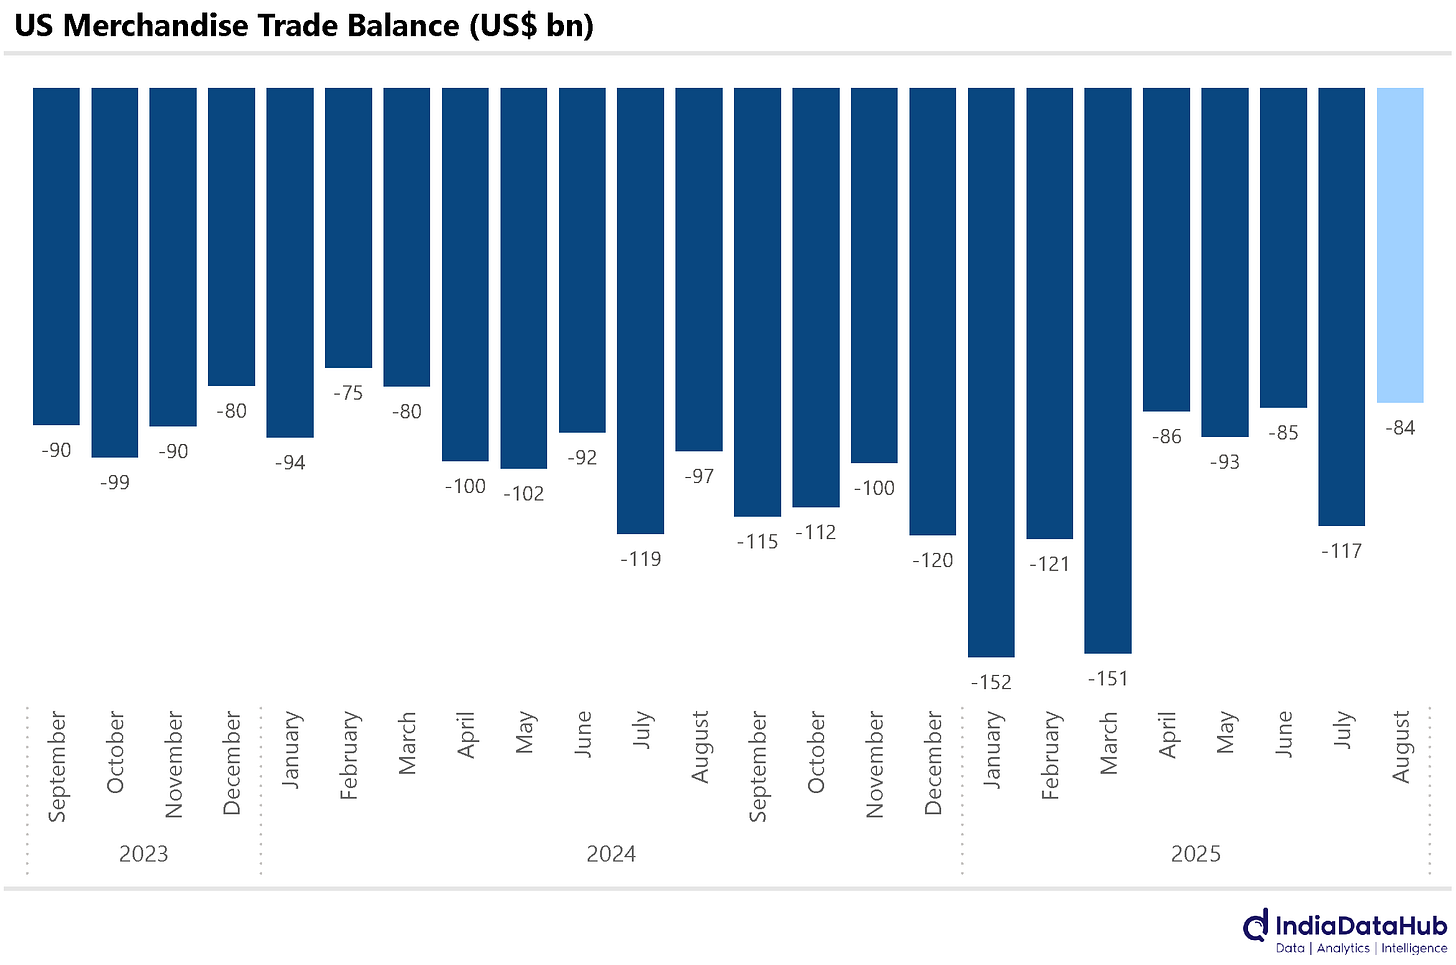
US Exports and Imports decline in August, first decline in recent months; Trade deficit at 17-month low
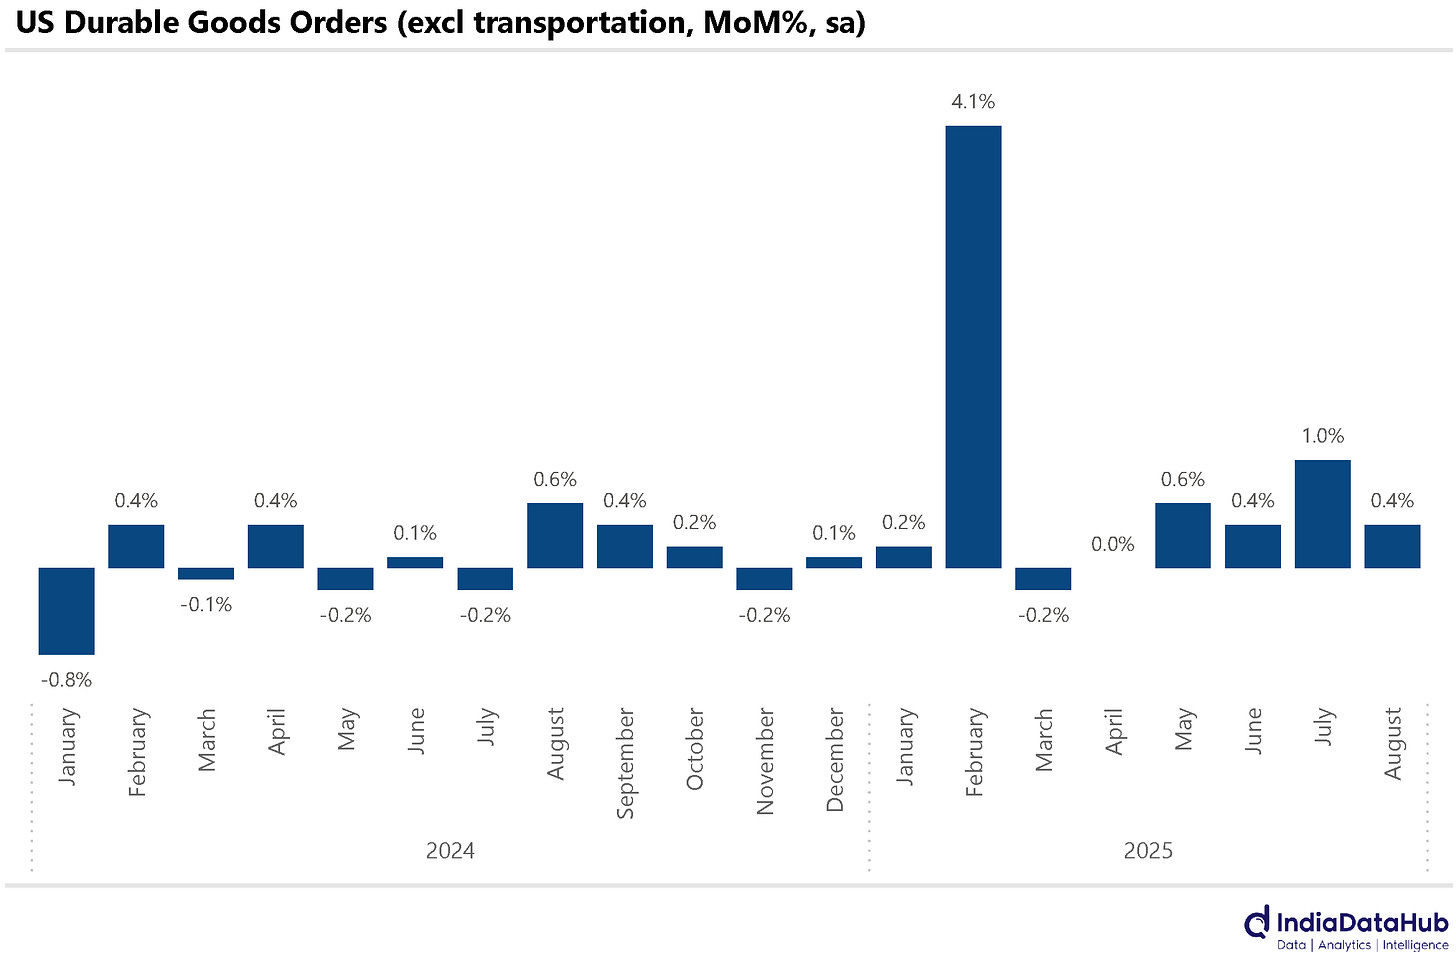
Durable goods orders continue to hold steady and GDP growth gets revised upwards
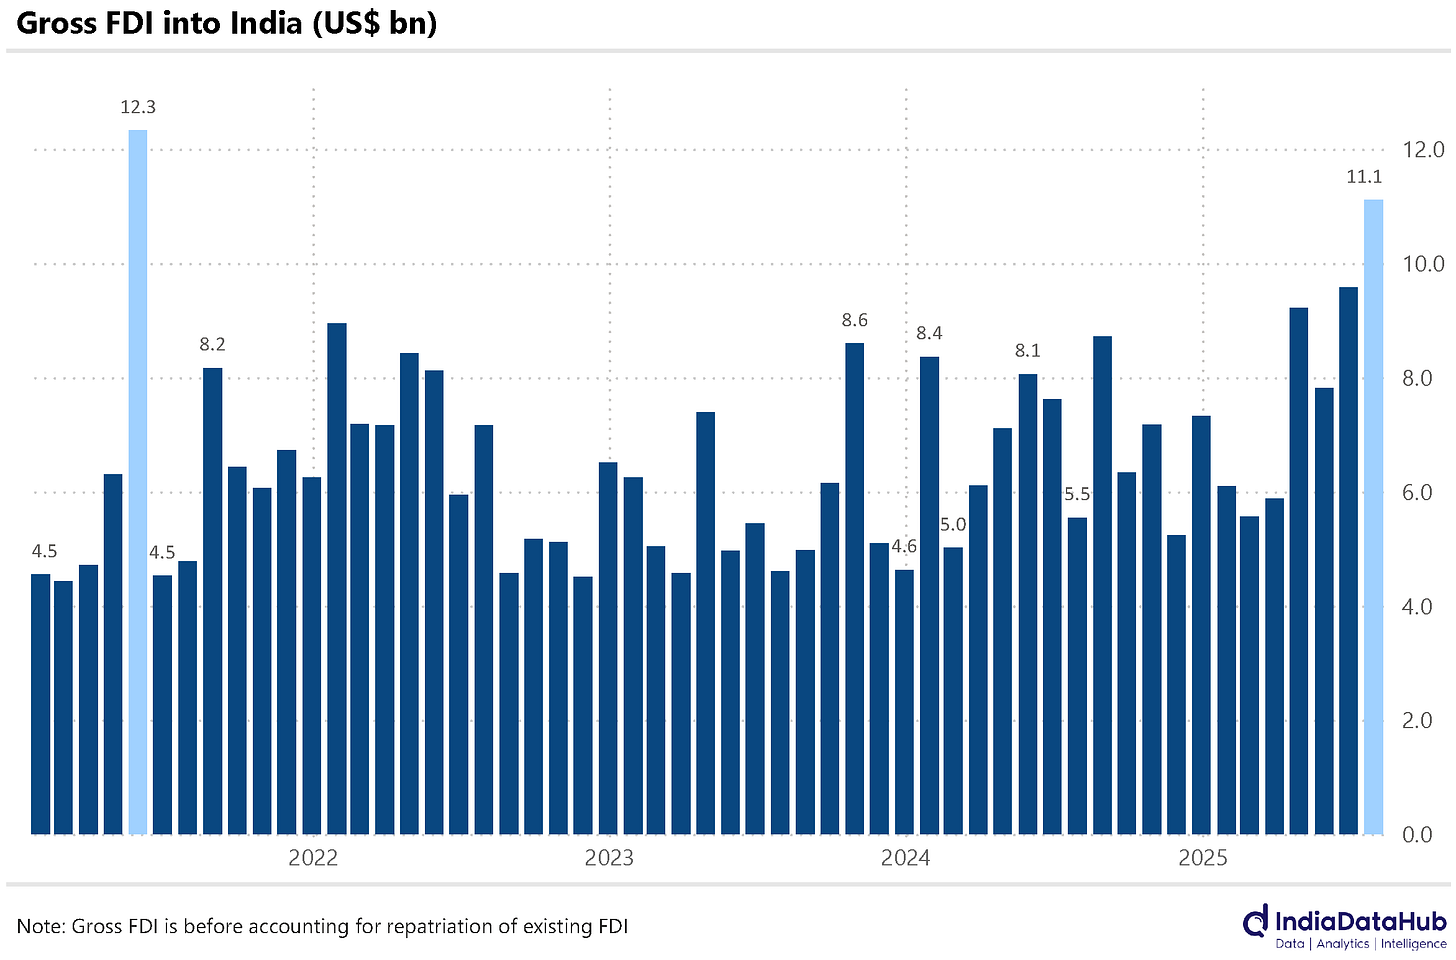
We had discussed last month that after a prolonged slump, FDI flows into India seem to be recovering. And July brought further confirmation of that trend. India received Gross FDI of US$11bn in July, the highest in the last few years. The second-highest monthly inflow was US$9.6bn in June. In the first 4 months of this year, India received gross FDI of US$38bn, the highest ever and up a third on a YoY basis.
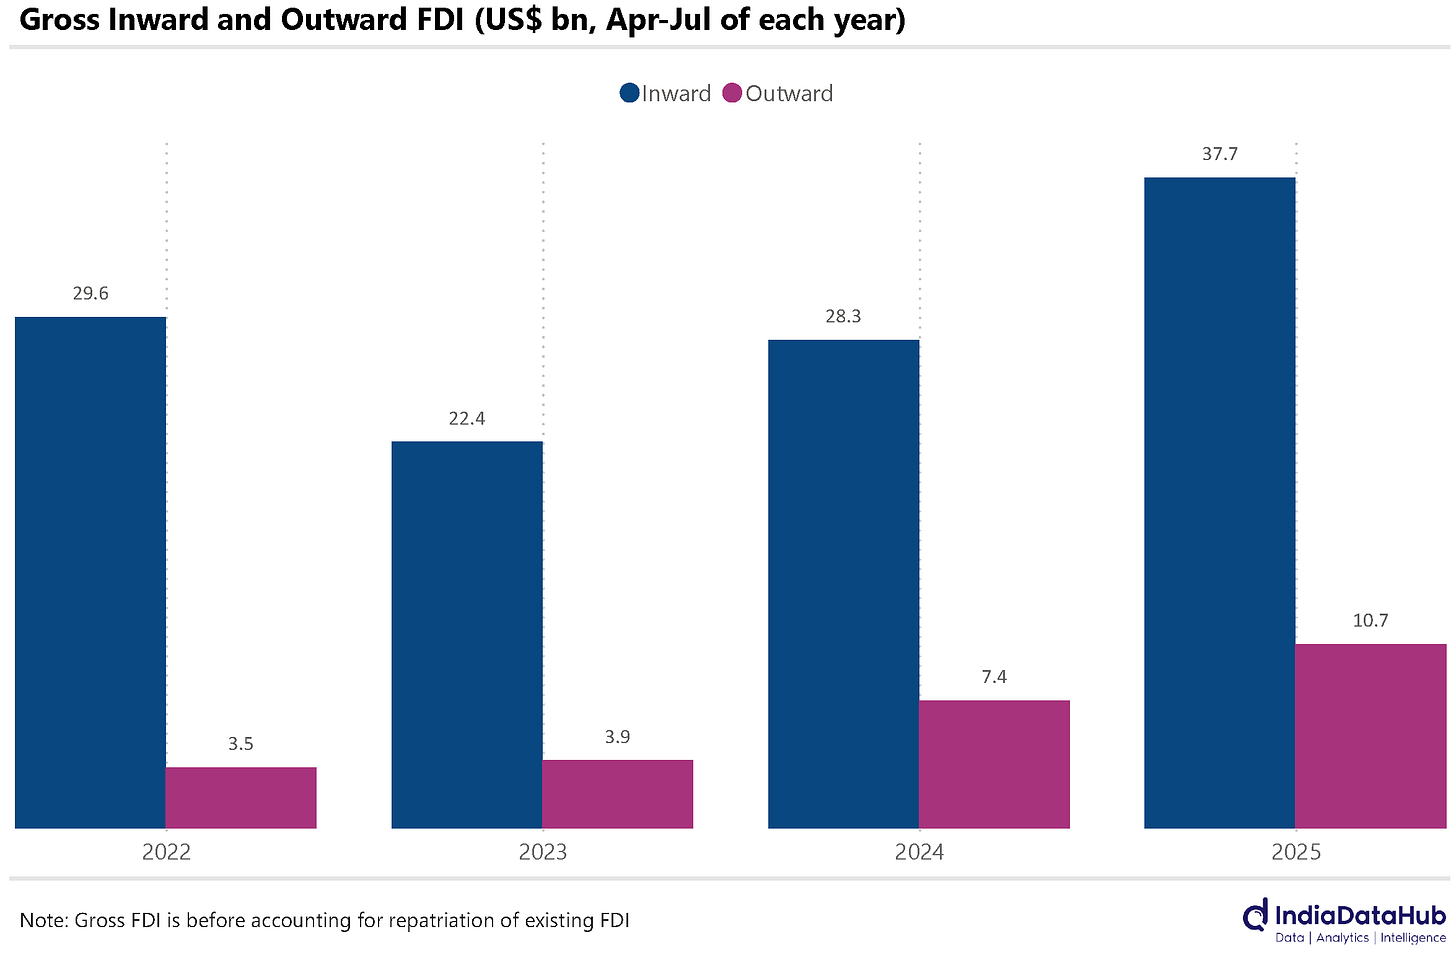
That said, along with inward FDI, what is also rising is the outward FDI. In the first 4 months of this financial year, Indian businesses invested US$10.6bn outside India as FDI. This is up 40% on a YoY basis. While in absolute outward FDI by Indian businesses remains small, the higher growth in outward FDI nevertheless drags down the net FDI received by India.
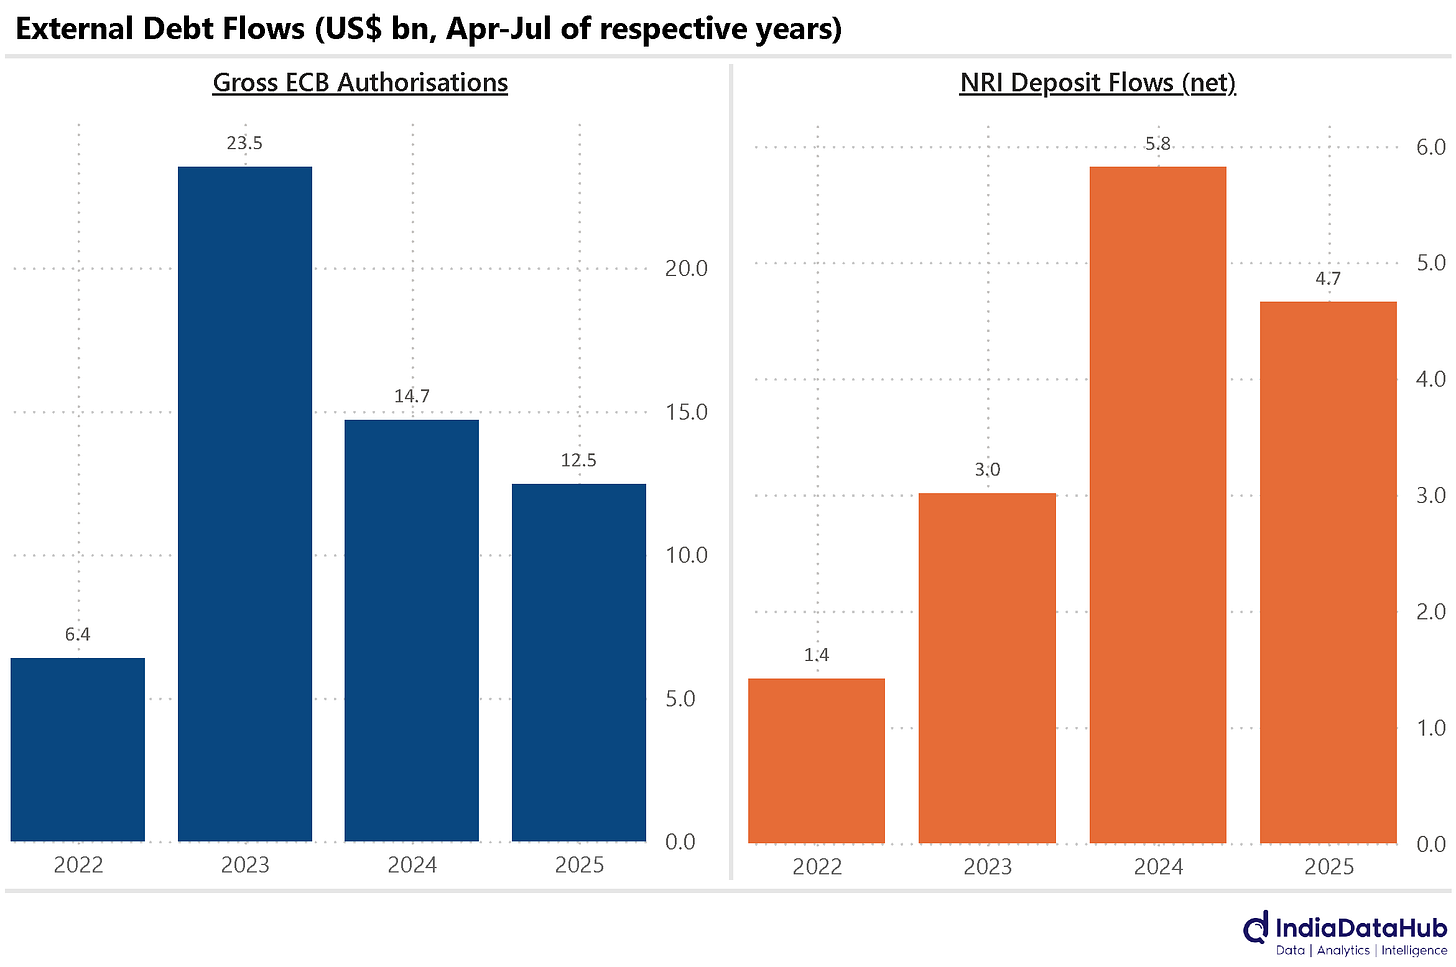
While FDI has increased, overseas borrowings have decreased. In the first 4 months of this year, total borrowings from ECBs and FCCBs were US$12.5 bn, down 15% YoY. And even inflows through NRI deposits have moderated. The first 4 months of this financial year have seen net inflows under NRI deposits total US$4.7bn, down US$1.1bn from the same period last year. Thus, a fair bit of the higher FDI flows has been offset by weaker flows under other heads. And not to mention the weak FPI flows.
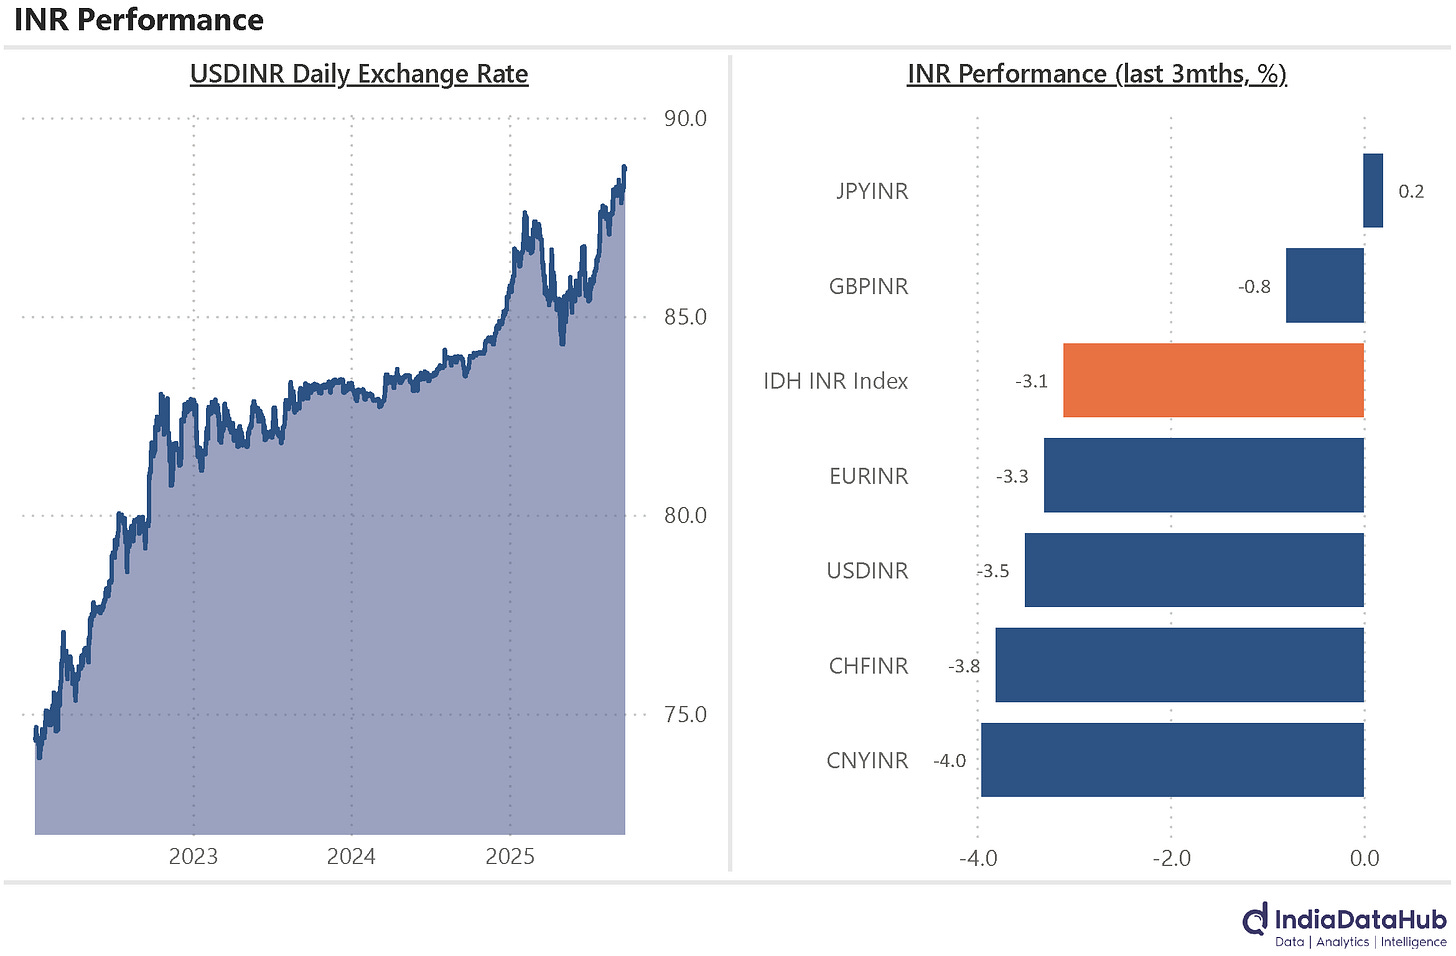
And this is largely the reason behind the weak rupee. The rupee closed close to 89 against the USD yesterday. Over the past 3 months, the rupee has depreciated by over 3% against the US Dollar. More importantly, the depreciation in recent weeks has been broad-based – meaning the rupee has depreciated against most major currencies.
So, it is not a case of strength in the USD but rather a case of INR weakness. Accordingly, the IDH INR has also declined by ~3% in the last 3 months. Even over the past year, while the rupee has depreciated by 6% against the US Dollar, the IDH INR Index has also fallen by approximately a similar magnitude. The biggest decline in the INR has been against the EUR and CHF, where the INR has fallen by ~10% over the past year.
Lastly, payments. And overall non-cash payments saw a sharp slowdown in growth in August, with growth slowing to just 5% YoY from mid-teens growth in the preceding few months. A large part of this was due to the slowdown in RTGS payments. RTGS payments grew just 3% YoY in August, down from mid-high teens in the preceding few months. But even retail payments saw a slowdown. Retail digital payments (total payments excluding RTGS and Cheques) grew by 11% YoY in August, the slowest growth since February.
One wonders if this is another manifestation of the temporary disruption in business activity caused by the announcement of GST rate cuts in mid-August, but which were effective only from early this week. If so, the business activity will recover in September, and so should the growth in Payments.
Globally, this was relatively light in terms of data releases, except in the US, which saw quite a few releases. Starting with the merchandise trade data. The advance release from the U.S. Census Bureau showed that exports declined by 1.4% year-on-year in August. This is the first decline in US exports since December last year. Imports also saw a notable drop, falling 5.6% YoY in August, the sharpest decline in the last few years.
Among major import categories, consumer goods experienced the sharpest year-on-year decline at 17.8%, followed by automotive vehicles, which fell by 11.6%. While most import categories saw declines, capital goods stood out with a double-digit positive increase.
The merchandise trade deficit narrowed from US$117bn in July to US$84.2bn in August, down 13% on a YoY basis. In absolute terms, the trade deficit in August was the lowest since March last year.
The US also released data on durable goods orders. And new orders for domestic durable goods rose by 2.9% MoM (sa) in August, following two consecutive months of decline. Excluding the volatile transportation segment, new orders grew 0.4% MoM, broadly the same growth as in the previous few months. So steady underlying growth in demand for capital goods (durable goods).
Lastly, the third estimate of U.S. GDP for the June quarter, as reported by the Bureau of Economic Analysis (BEA), showed a 3.8% seasonally adjusted annual rate, an upward revision of 50 basis points from the previous estimate in August.
That’s it for this week. We look forward to the RBI monetary policy next week. A status quo on rates is the most likely outcome, but we shall see…

