Recovering state capex, moderating credit growth, strong port traffic, falling Chinese CPI and more...
This Week In Data #9
In this edition of This Week In Data we cover:
Signs of a recovery in state capex
Deceleration in Bank credit growth
Continued strength in cargo traffic at ports
Deceleration in other frequency data
Chinese CPI!
In case you missed, we released a major upgrade to our money markets dashboard. The dashboard now covers the bond, CP as well as CD markets. See this video for a quick overview.The unwillingness on the part of states to spend (capex) has been one of the oddities of the post covid recovery. In FY19 for instance, the capital expenditure of all the states was 50% higher than that of the Central government. In FY22 the aggregate capex of all the states was slightly lower than that of the Central government. In part, this is due to the sharp increase in the Central government’s capital expenditure. But equally, state capital expenditure has only seen a modest growth – 22% growth between FY19-22 (in absolute terms) which is even lower than its growth in revenue expenditure which was 26%.
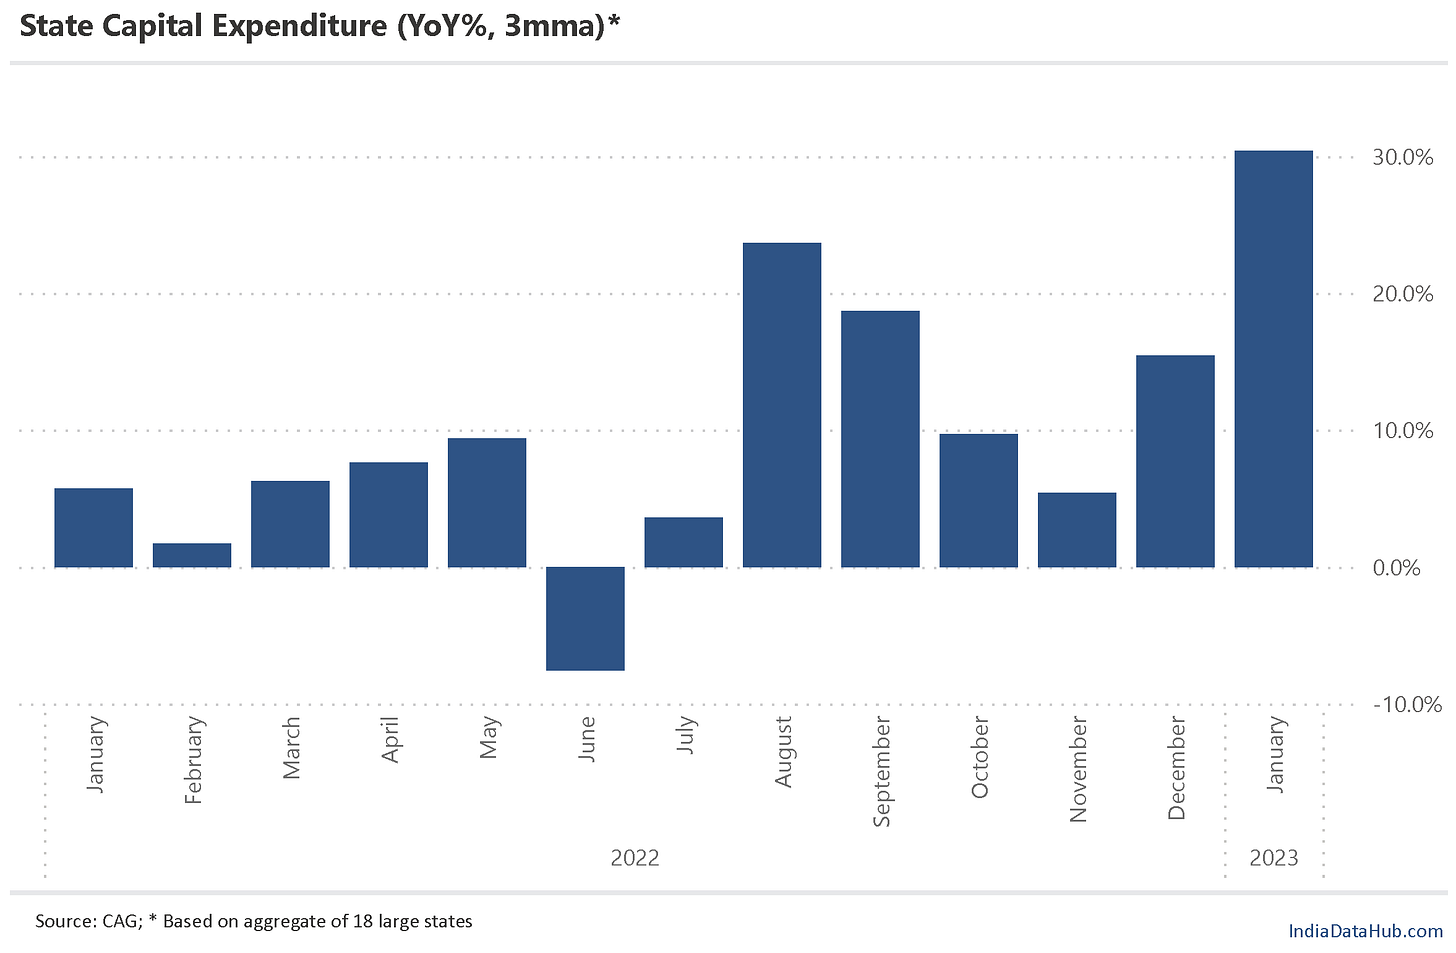
This trend continued in the first few months of the year. But in the last three months, this has changed. Based on the aggregate data of the 18 large states, aggregate capital expenditure has increased by 30% YoY in the last 3 months as against just 5% growth between April – October. As we explained in our monthly report Fiscal Matters, state governments have generally seen stronger revenue buoyancy than the Central government in the past few quarters since they rely more on ad-valorem taxes. However, they have used this buoyancy for fiscal consolidation rather than on capex. However, if revenue buoyancy continues then as we head into the election-heavy next few quarters, this momentum behind state capex is likely to continue. This will be a big fillip to the domestic investment cycle if this materialises.
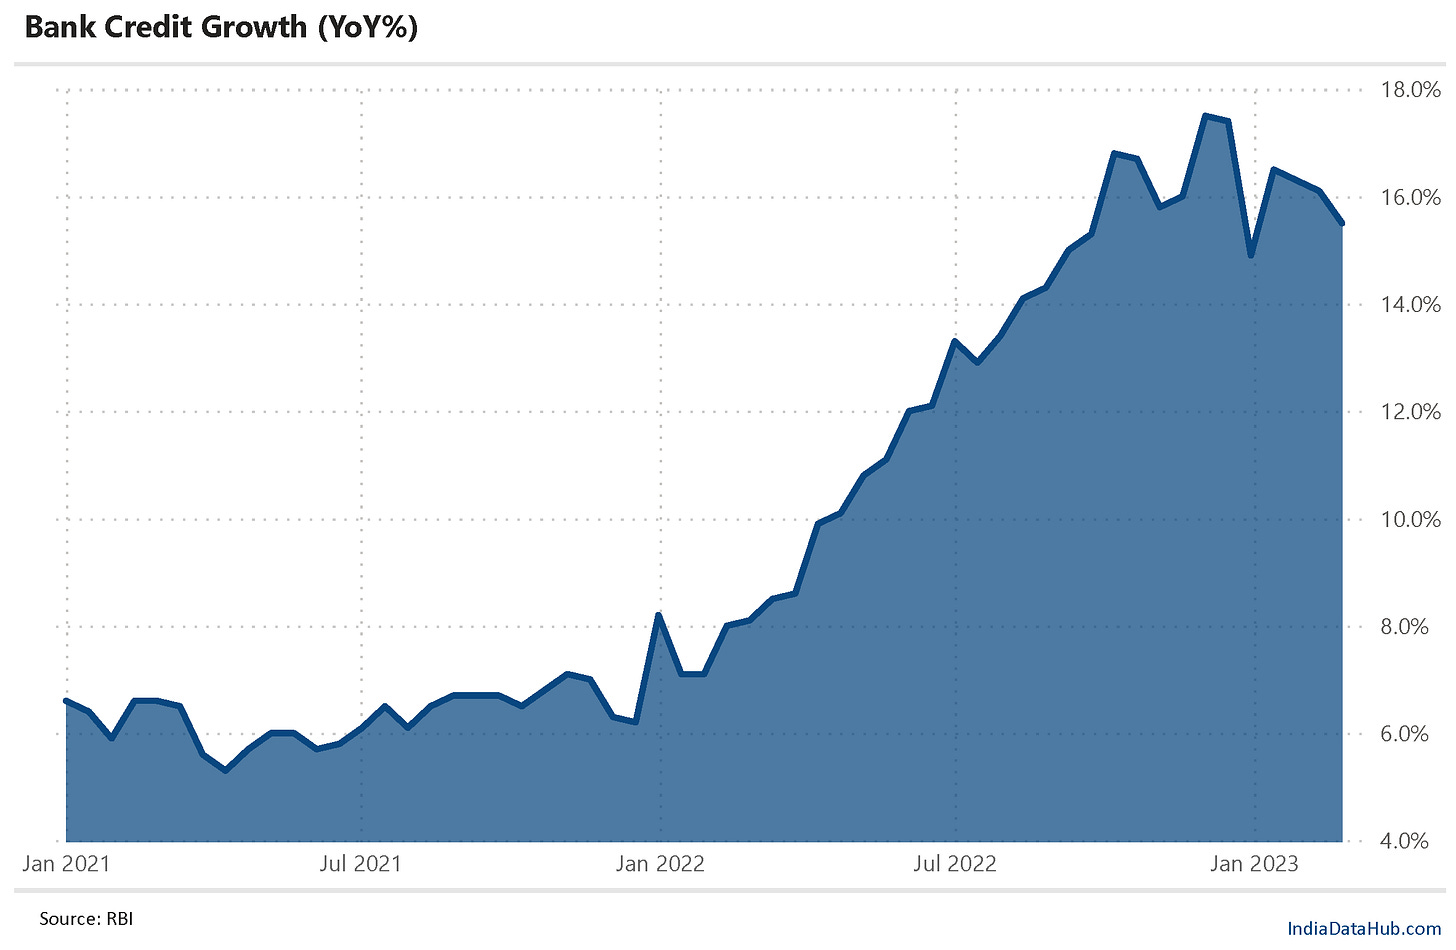
Credit growth recovered in January after the blip in the last fortnight of December. But it has been decelerating since then for the last three fortnights. As of 24th Feb, credit growth was 15.5%, down from 16.5% in January and 17.5% in early December. And it is the lowest since September last year (barring the last fortnight of December). Deposit growth has also moderated, but only by 40bps so the gap between credit and deposit growth rate has narrowed from a peak of 8ppt in December to 5ppt in February. Part of the reason for the slowdown in credit growth is lower inflation (wholesale inflation specifically, which reflects the impact of commodity prices). And to that extent, this is not worrying. But given that we are all looking for signs of a slowdown in the economy, this remains something to keep tracking in the next couple of months.
Another interesting trend in the data is the divergence between value and volume in external trade. In December and January, merchandise trade grew 0% in value (USD terms). However, cargo traffic at ports grew by double digits. And in provisional data released this week, cargo traffic at major ports (~50% of total cargo handled), grew in double digits in February as well. Effectively, foreign trade is continuing to see strong growth in volume terms even as in value terms growth has come to a standstill. This underscores the point made above regarding lower inflation dragging down credit growth – both bank credit and merchandise trade are nominal indicators. Cargo traffic is a real or volume metric. In times like this when commodity prices rose rapidly and are now cooling, volume indicators offer a better read on the economy than value indicators.
Among the other key high-frequency data released during the week were GST EWay bills, Railway freight and Petroleum product consumption. As expected, all of these variables saw a deceleration in growth given that the January growth rate was buoyed by the Omicron base. However, the moderation was modest and EWay bills still grew over 20% YoY in February. More important was the NREGA data – demand work under NREGA in February was lower than in February 2020. This is the first time since the start of the pandemic that demand for work is lower than in the pre-pandemic period.
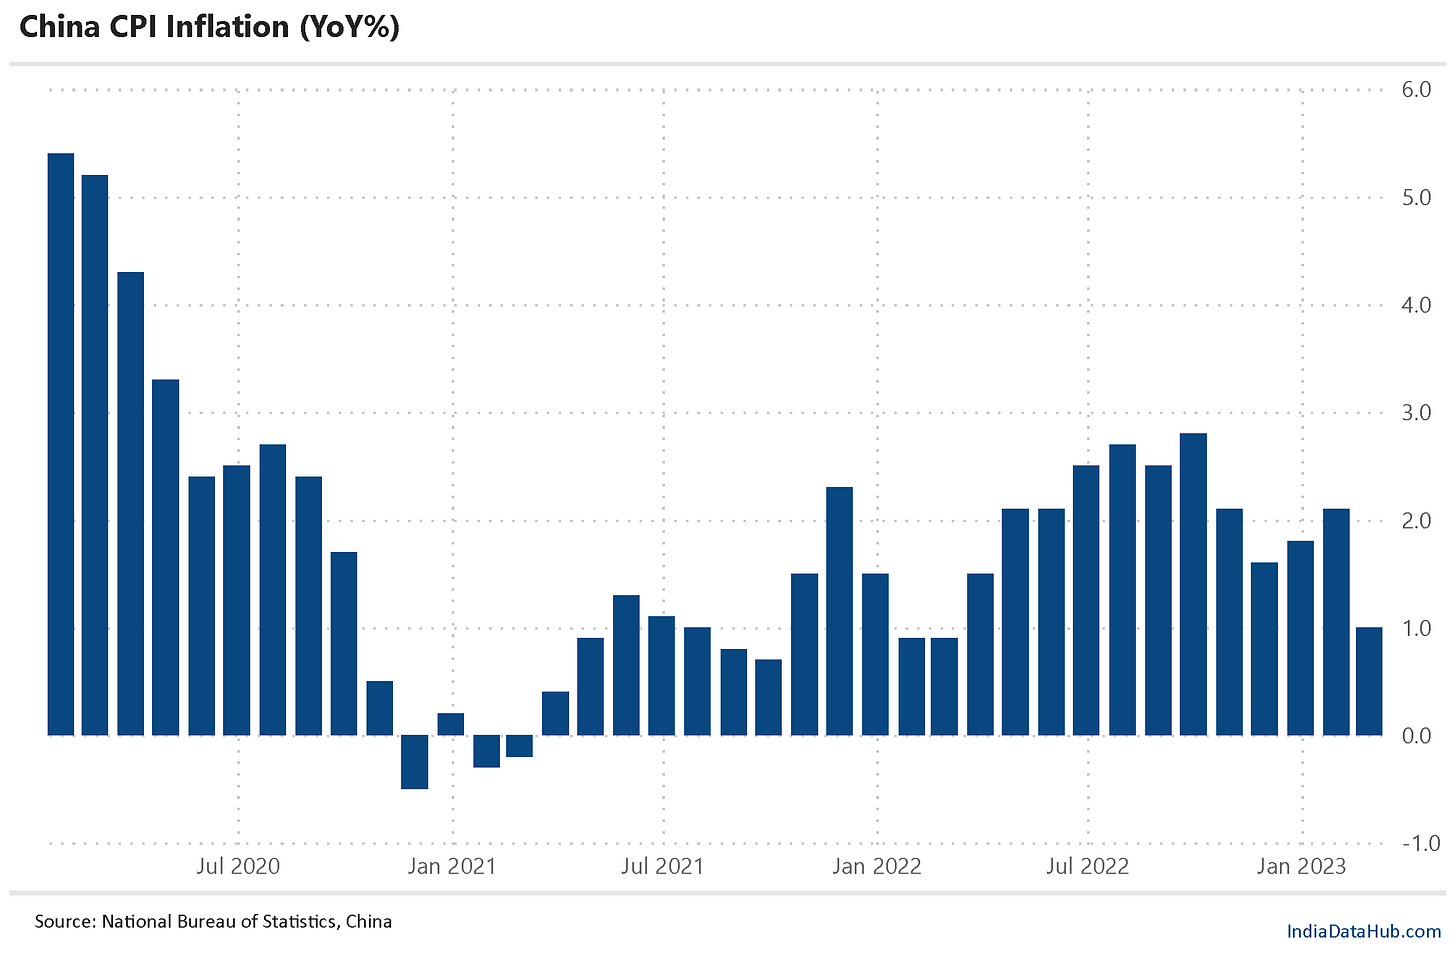
On a side note, world over most countries are battling with high inflation. The major central banks are raising rates to slow down growth and bring inflation under control. But there is a country (a large one at that) which reported just 1% inflation. China reported that CPI Inflation in February was just 1% YoY, down from 2.1% YoY in January. This is the lowest CPI print in the last year! No wonder interest rates remain low (the 1-year loan prime rate is at just 3.65%).
Thats not it for this week. The most important data of this week is yet to be released! The US Non-farm payrolls data that will influence US and in turn global interest rate expectations and in turn equity markets will be released later this evening. We will cover it next week! So that’s it for this week, from us 😊


