Tax collections, Strong core sector growth, payments and more...
This Week In Data #37
In this edition of This Week In Data, we cover:
Robust growth in direct taxes in August
Continued strength in government capex
Strong core sector growth which could be misleading
Recovery in payments growth
Stable US House prices
Falling Euro Area Inflation
In case you missed, we published the second of our thematic reports this week. We take a data dive into Small Finance Banks and explain how they have grown, which regions and segments they have grown and what has their performance been. If you are a subscriber to IndiaDataHub, you can get the report from here.We had written about the disappointing tax collections, especially direct taxes a few weeks back in this newsletter. However, August was an exceptionally strong month for direct tax collections. Corporate tax collections rose 5x YoY and Personal income tax collections rose 4x. And consequently, overall gross tax collections almost doubled YoY in August. YTD Gross tax collections have now grown in the mid-teens and are tracking above the full-year budget estimate which is for low double-digit growth.
At least to some extent, this tax buoyancy is due to strong activity in August which has happened due to weak monsoons. Sectors like construction and mining (more on it later) which generally see weak activity in August have seen strong activity due to significantly below normal rains. And because August is not an advance tax month, the tax collections during the month would reflect TDS collections which are directly linked to underlying transactions. But the sheer quantum of tax collections suggests that this alone is not the full explanation. September thus becomes an important month since companies and individuals pay advance tax which reflects their estimated full-year tax liability. If September also turns out to be a reasonably strong month for tax collections, then the concerns over full-year tax collections will abate significantly.
On the expenditure side, capital outlay continues to grow faster than revenue expenditure and so expenditure quality continues to improve. It is rare for a single month to dramatically alter the full-year picture. But it appears like that is just what may have happened in August.
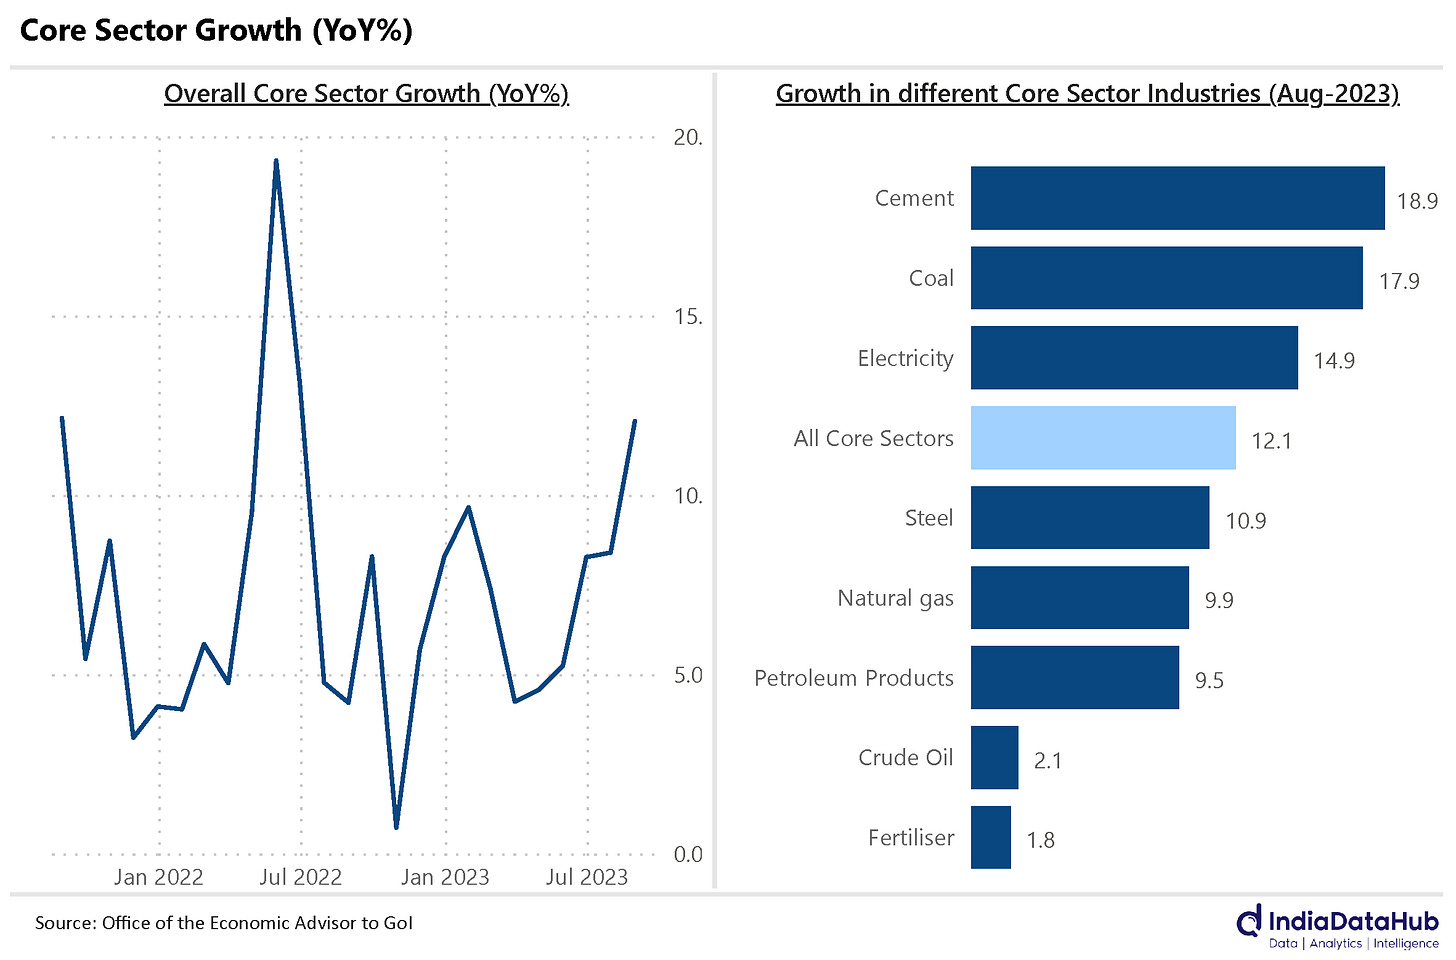
Picking up from the point of August seeing strong activity, the core sector index saw a growth of 12% YoY in August. This is the highest growth in the over a year. This was driven primarily by Coal, Cement and Power. All these three sectors grew in the mid-high teens. A large part of the growth in each of these three sectors is due to the deficient rainfall in August. We explained how the spike in electricity generation in August is not representative of underlying strength in demand a couple of weeks back. Higher cement production reflects stronger construction activity which otherwise tends to slow down in August. Coal mining too slows down in August due to rains and that did not happen this year.
The point is that the strong growth in August should not be extrapolated to subsequent months. That said, the strong core sector growth will flow through to slightly higher GDP growth. So, we should expect analysts to revise their September quarter GDP growth numbers as they plug some of this data into their models.
The RBI released the payments system data for August this week. And that provided further evidence for August being a strong month for activity, especially consumption. Overall non-cash payments growth accelerated to a 7-month high of 19% YoY in August. Even in volume terms (number of transactions), growth in payments accelerated to a 6-month high.
More importantly, credit card payments, which largely reflect discretionary payments, grew 32% YoY, a six-month high. And the gap between credit card and UPI payments growth was down to just 15ppt, the slowest in over a year. So, the data is pointing towards strong consumption spending at least in the urban areas.
Globally, we saw house price data for the US. After heady growth in 2021 and most of 2022, house prices have stabilised as per the S&P Case Shiller Index.
On a YoY basis prices were almost unchanged in July, the fifth consecutive month of close to 0% increase. Through 2021 and most of 2022 prices had been growing in double-digit terms.
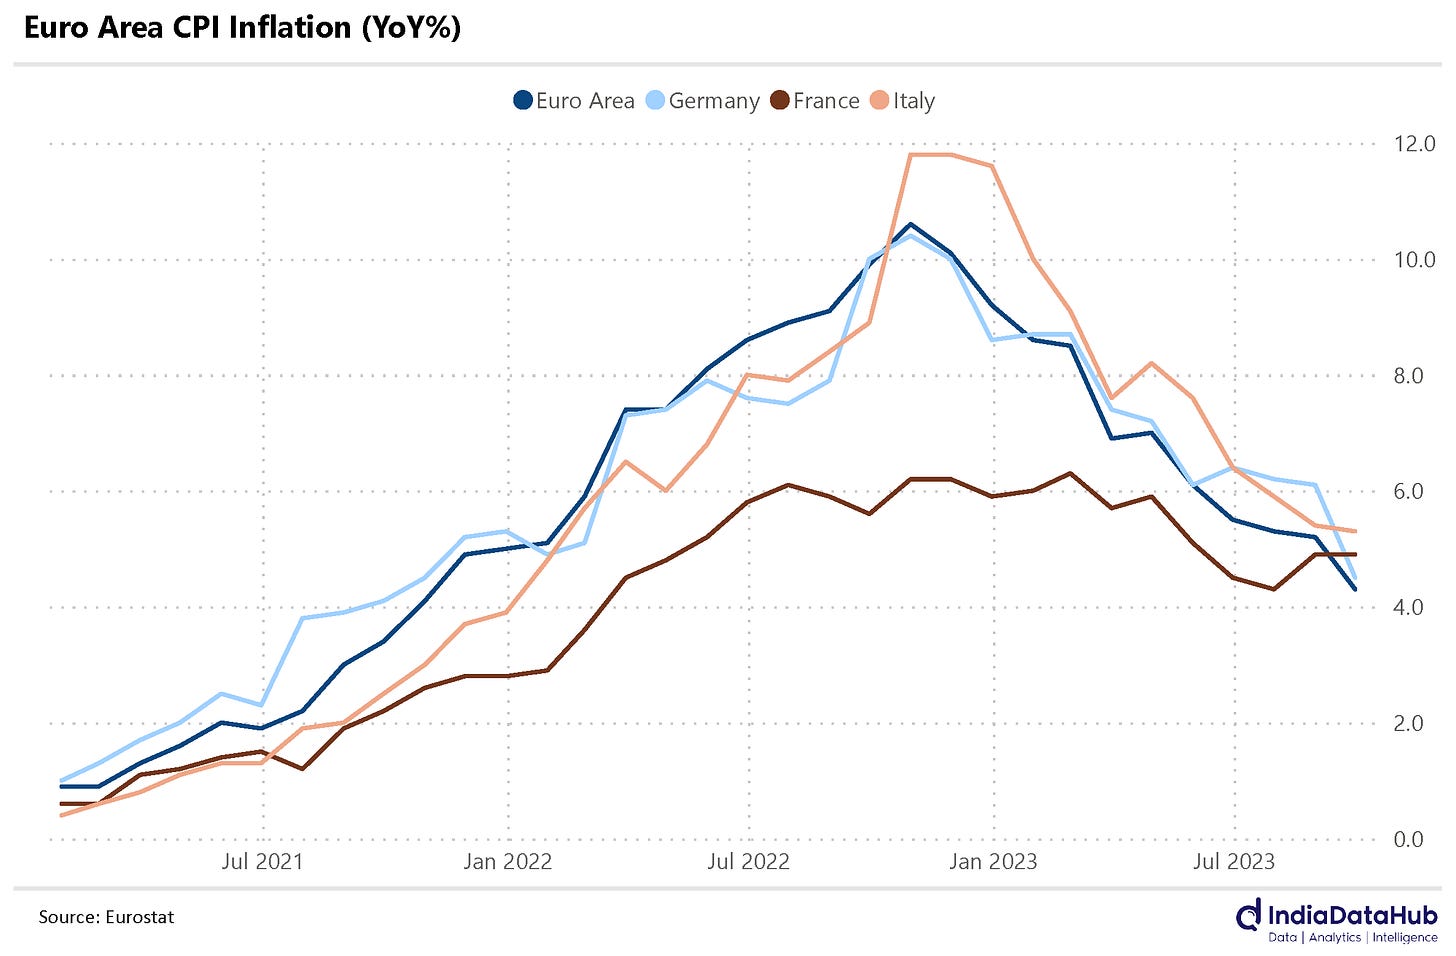
And inflation fell in the Euro area in September as per the flash estimate. And it fell sharply. CPI Inflation fell 90bps to 4.3% YoY as per the flash estimate. This is the lowest reading in almost 2 years. While food prices continue to see a sharp uptick (almost 9% YoY in September), energy prices declined almost 5% YoY and helped drag down the inflation.
Among the various member countries, Germany saw the biggest decline in CPI – CPI in Germany printed at 4.5% YoY, down from 6.1% in August. So, this should ease some of the ECB’s concerns and allow it to pause in its next policy meeting in October.
That’s it for this week. See you next week.


