Weak Corporate results, Weak Capex, Record FPI Outflows and more...
This Week In Data #99
In this edition of This Week In Data, we discuss:
September quarter results have been weak so far in aggregate
Corporate tax collections recover in September but remain weak for the quarter
Central government capex declines again in September
FPI outflows from Equities in October was record high
US economy continues to grow at steady clip
US labor market however continues to soften
We have got a bit off track in terms of publication scheduling due to personnel travel and Diwali. Will get back on track next weekend onwards which will also be our 100th edition on substack. Yay...!!!September quarter is turning out into another weak quarter for corporate profitability. With the bulk of the reporting season behind us, and most large companies having reported, overall corporate revenues have grown 8% YoY. This is likely to be the sixth consecutive quarter of single-digit revenue growth. More importantly, aggregate profits have declined 3.5% YoY so far. This will be the first quarter of profit decline since 3QFY23.
Corporate tax collections recovered in September growing 12% YoY after two months of decline. However, despite this, YTD corporate tax collections have grown by just 2% YoY with an 8% decline during the September quarter. Corporate tax collections and corporate profit growth have thus broadly been in sync. Personal income tax collections grew 23% YoY in September. However, even income tax collections have seen a slowdown with growth moderating to 7% during the September quarter, the slowest in the last few years.
However, despite this, YTD the central government’s total receipts have grown in the mid-teens, a healthy pace. This though is not flowing through to higher capex. It was expected that post elections capex will recover, but the Central government’s capex declined 2% YoY in September, the second consecutive month of decline. In August capital expenditure had declined by 30% YoY. Thus, in the first half of the year the Central government’s capital expenditure declined by 15% YoY.
October saw over US$11bn of FPI selling in equities. This is the highest monthly selling ever. The previous highest was US$8.3bn in March 2020. The outflows would have potentially been even more but for inflows of US$2.4bn in the primary market.
FPIs were net sellers in debt also with outflows totalling just over US$400m. And as a consequence, FX reserves have declined by ~US$20bn in the past 4 weeks.
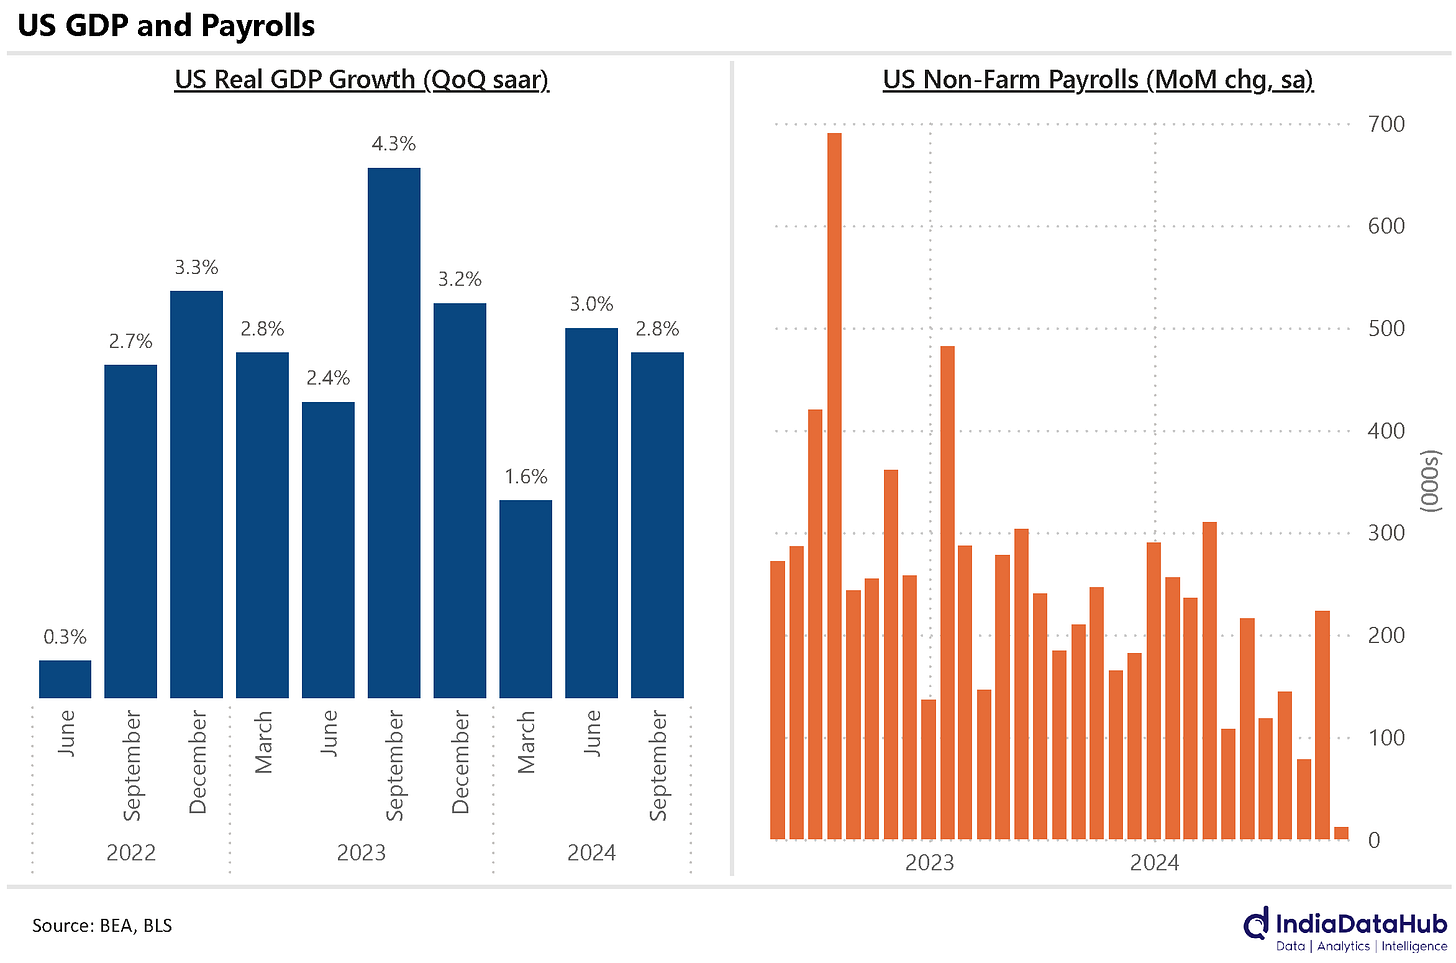
The US Bureau of Economic Analysis released the advance estimate for 3Q GDP growth on Thursday. Real GDP grew 2.8% Saar during the September quarter, down slightly from the 3% growth during the June quarter but broadly in line with the average of the preceding few quarters. And in absolute terms, 2.8% is a healthy growth for the US economy. So as of the September quarter, the US economy was growing at a reasonable clip.
But incrementally, the labor market continues to soften. The US Bureau of Labour Statistics released the non-farm payroll data for October on Friday and it was a very weak number. The US economy added a mere 12k jobs in October as per the initial estimate. This is the lowest job growth in this cycle. A small caveat is that the data for October is distorted partially by hurricanes Helene and Milton. But more importantly, the job growth in the preceding two months was sharply revised down. Cumulatively, the two months have seen 112k lower job growth compared to the earlier estimate.
A weak labor market will eventually flow through to softer GDP growth. In sync with this, the markets are currently estimating another 50bps of rate cuts from the Fed till the end of the year (25bps rate cut in each of the two meetings).
That’s it for this week…


Please keep posting these data charts. It really simplifies how we look at the Indian economy. Your festival breaks are deserved, but please don't stop making these charts for us 🙏
Love your weekly reports.. If possible can you provide printer friendly copy of this report with the substack article? By printer friendly I mean Charts and Texts are adjusted in such a way which optimizes the A4 Paper Size (less blank spaces).
The Print Option from browser splits image across 2 pages.
BTW Last 2 Charts are same..