Wheat Stocks, Data consumption, Road construction and more...
This Week In Data #62
In this edition of This Week In Data, we discuss:
Low wheat stocks and implications for procurement and inflation
Continued growth in wireless data consumption
Gradually change in the internet user base composition
Mixed FY24 for Road construction and Awards
NREGA in deficit
Weak US GDP growth
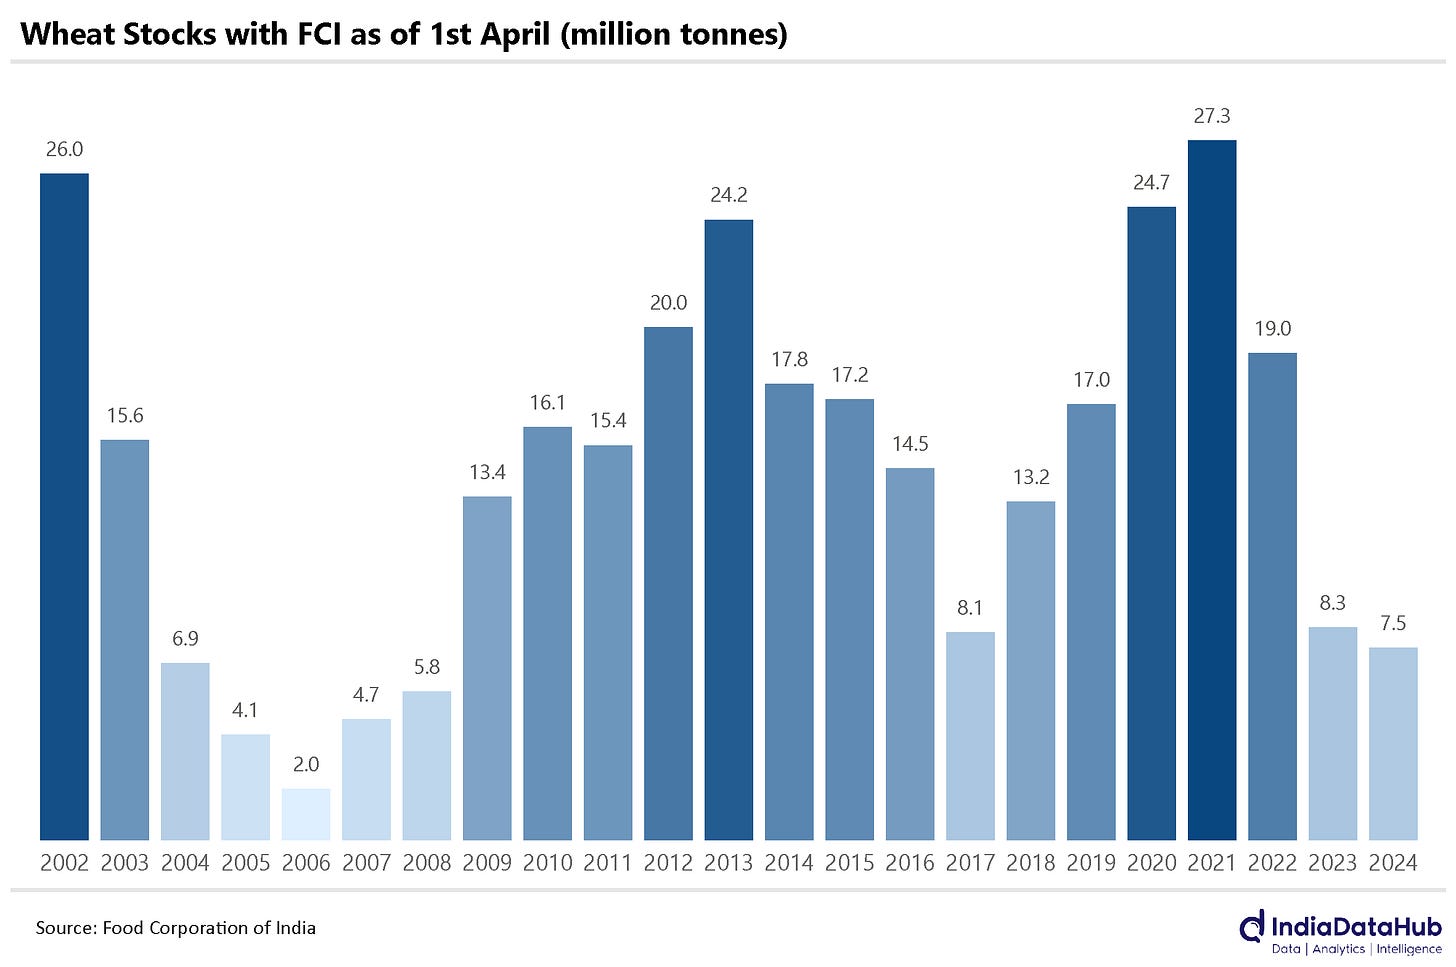
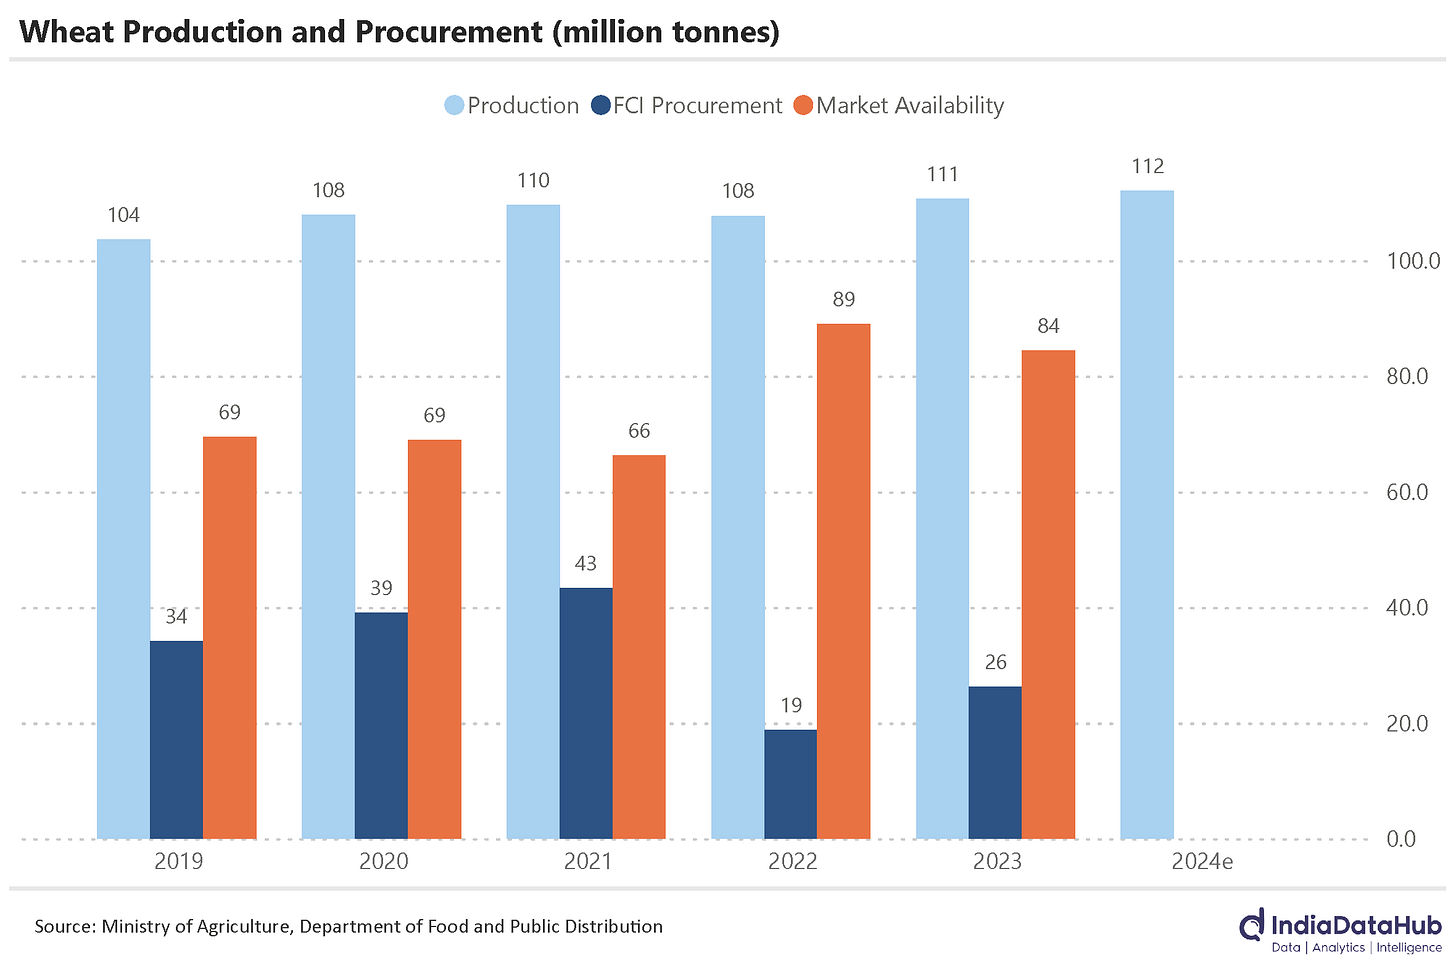
In case you missed, we released our web interface to visualise district data. We currently carry 4 categories of data at a district level - Automobiles, Banking, Agriculture and FDI. We will add more indicators as well as interactive features in the next few months. You can access the raw data through our Excel Plugin or API or from the Snowflake cloud. You can get a quick overview of it through this video The Rabi crop has started to hit the market this month. The most important Rabi crop is wheat. At the start of this harvest, wheat inventory with the FCI is just 7.5 million tonnes, the lowest since 2008. During FY24, the total offtake of Wheat under the Government’s various programs like the Public Distribution Scheme (PDS) was just over 26 million tonnes as against a production of 110 million tonnes. So last year the FCI distributed through the PDS and other schemes a quarter of the wheat production in the country.
This year Wheat production is estimated to increase by 2 million tonnes. However, the lower inventory means that the FCI will have to procure more than the offtake to increase its inventory level. And that means that the net market availability of wheat (for non-PDS use cases) will be flat or even lower than the last year. And that has implications for wheat prices which in turn impacts overall inflation and interest rates. Worth noting is that last year itself, FCI’s procurement was higher by 7 million tonnes and this resulted in lower net market availability of wheat by over 4 million tonnes.
The FCI will need to build its wheat inventory from current low levels to prepare for a year when wheat production may be lower. The question is when rather than if. And from a policy perspective, it might be better to take the impact on wheat inflation by procuring more and building up the inventory this year itself. The RBI is in no tearing hurry to cut rates and core inflation is very low and looks like it might remain low. So the impact on inflation is unlikely to be very large. And growth remains robust in any case. So as they would say in banking, let’s throw the kitchen sink and get done with it!
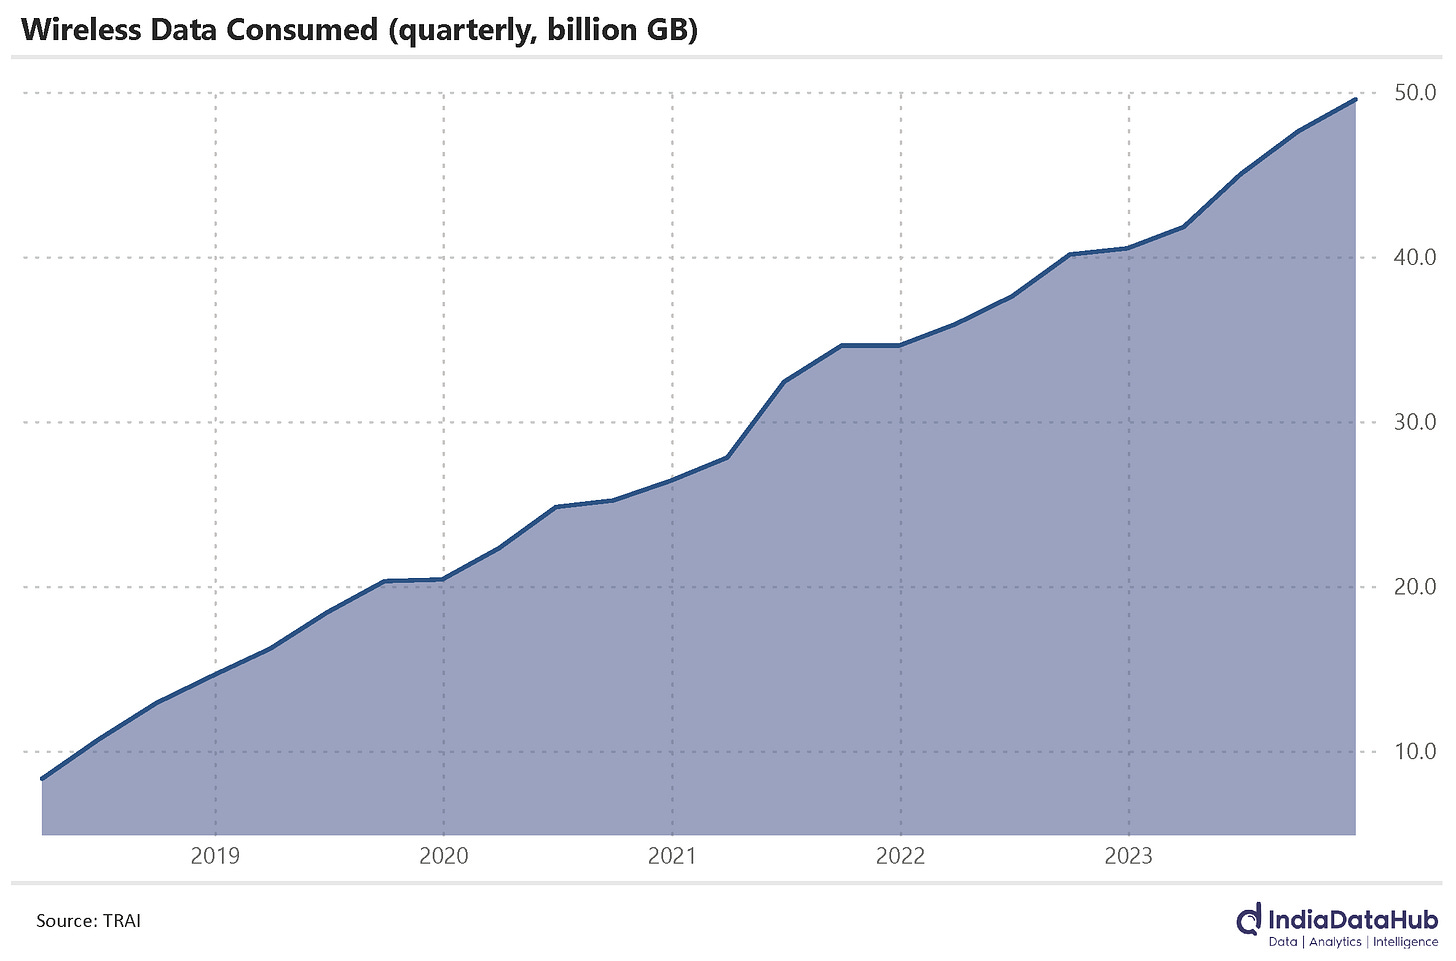
Wireless data consumption in India continues to uptick. TRAI released the data for the December quarter earlier this week. And during the quarter, the total wireless data consumption was almost 50 billion GB. And it increased more than 20% YoY, and this is the highest growth in the last 7 quarters. Wireless internet users grew by 8% YoY during the quarter, and this meant that the data consumption per subscriber rose to an average of almost 19GB per month. That is some serious amount of content being consumed per month. Over the past 3 years, the data consumption per user has increased by more than 50%!
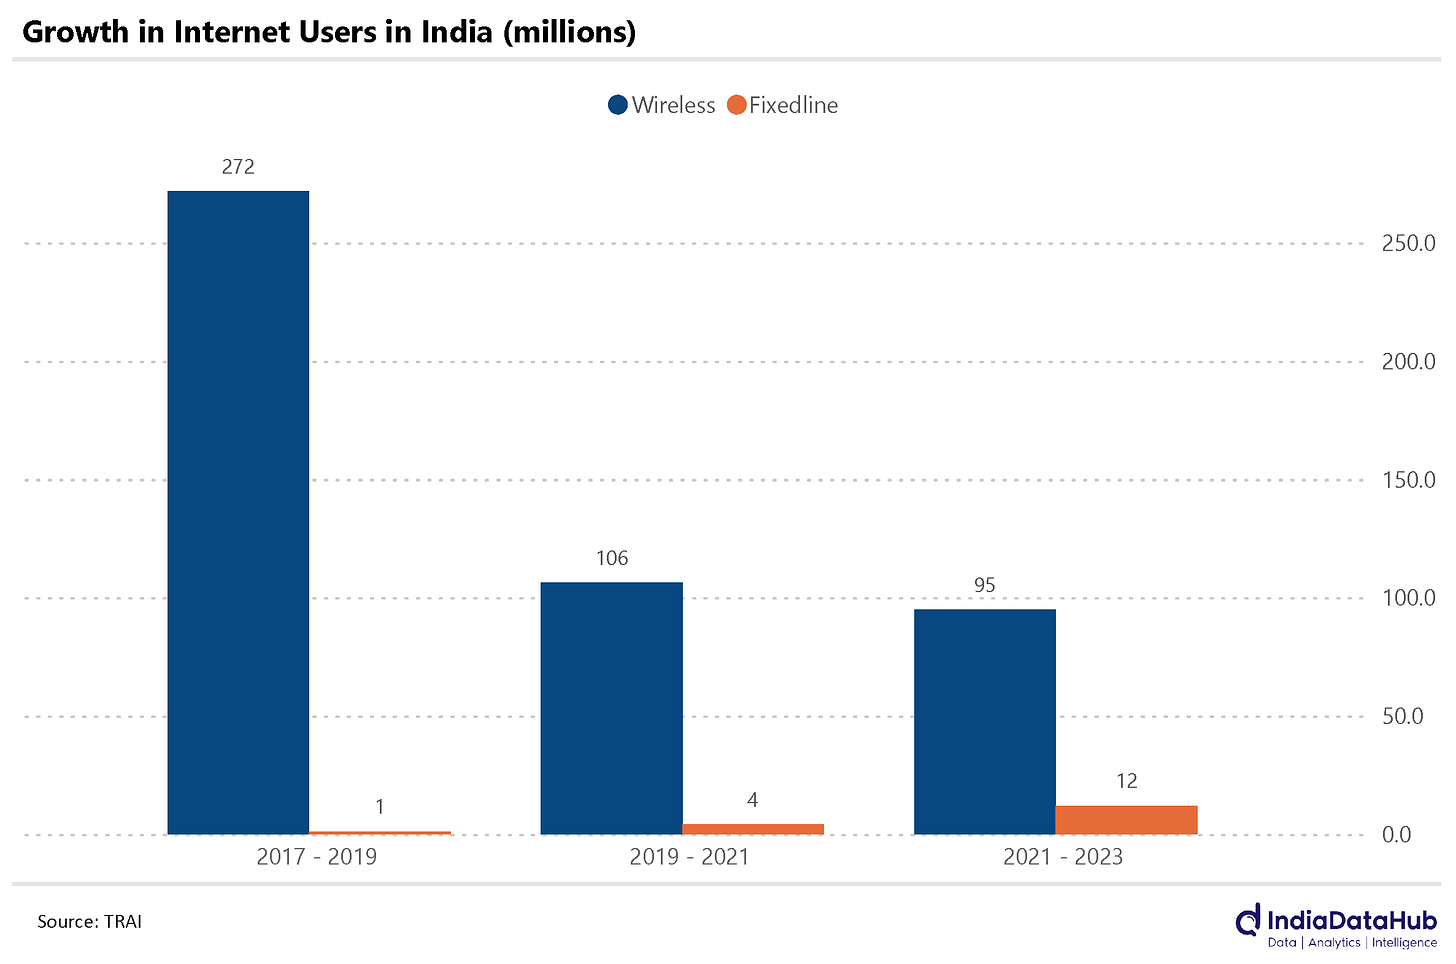
But at the margin, the internet access pattern is changing. While the number of fixed-line internet users is small in totality (less than 5%) they are growing faster than the number of wireless users. In the last 2 years (2022-2023) for instance the total number of internet users in India increased by ~110 million. And 11% of this incremental user base or 12 million were fixed-line internet users, 3x the growth in the preceding 2-year period, highlighting the growth of fixed-line broadband services.
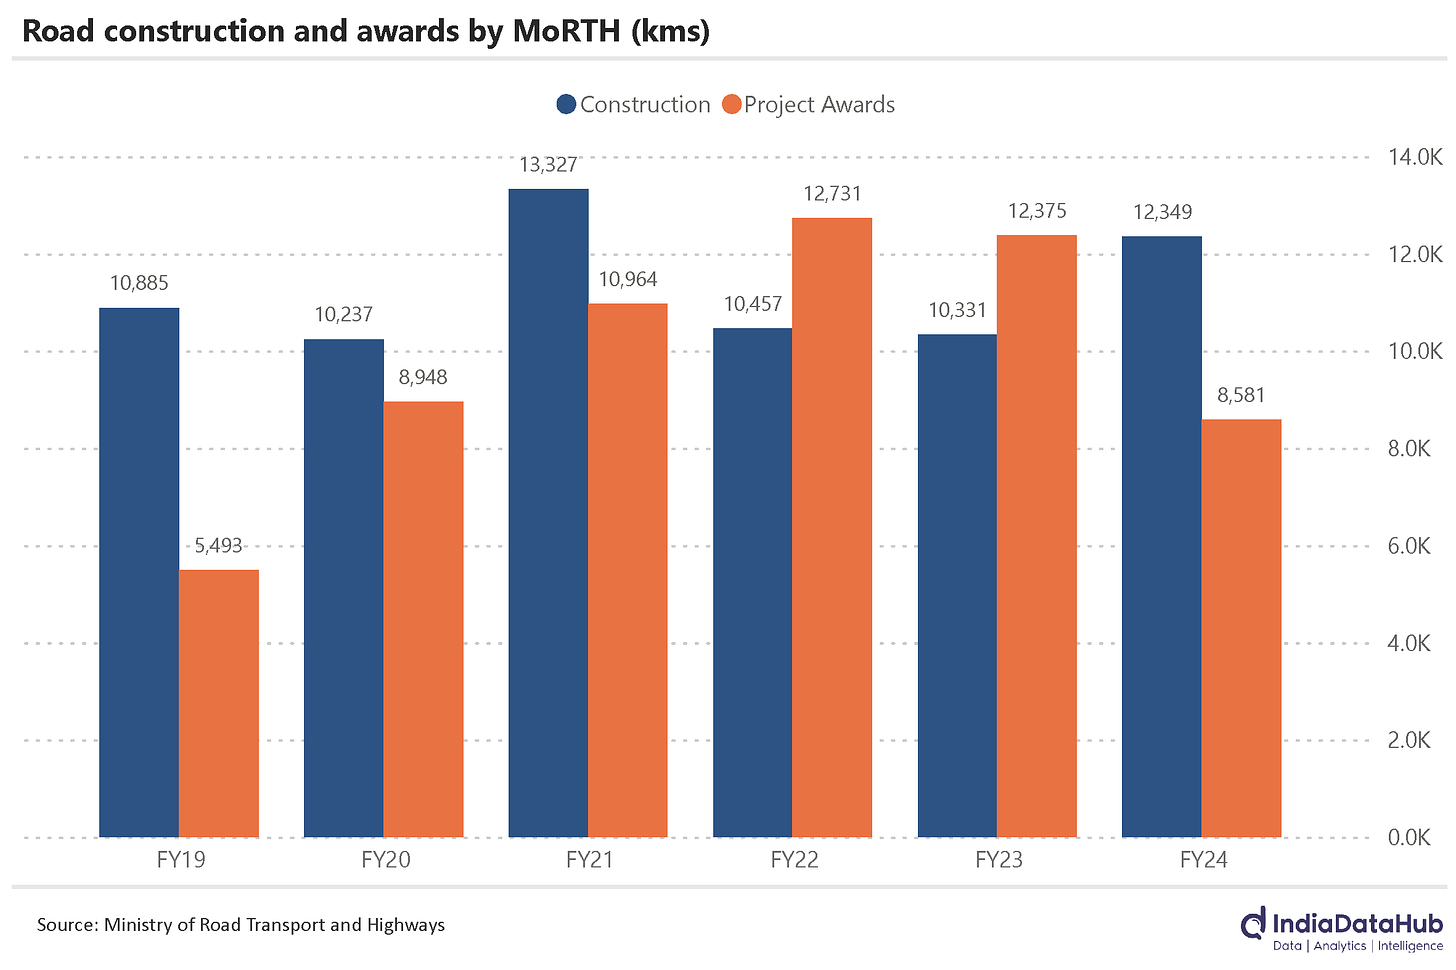
FY24 was a mixed year for the Road Transport Ministry (Ministry of Road Transport and Highways, MoRTH). It awarded road projects totalling 8581kms during the year. This is 30% lower than last year and is the lowest since FY19. Road construction, however, picked up. The ministry constructed roads totalling 12349kms during FY24, this is 20% higher than last year and is the highest in the last 3 years. In sync with this, the total capex of the ministry rose almost 25% YoY to Rs3000bn during FY24.
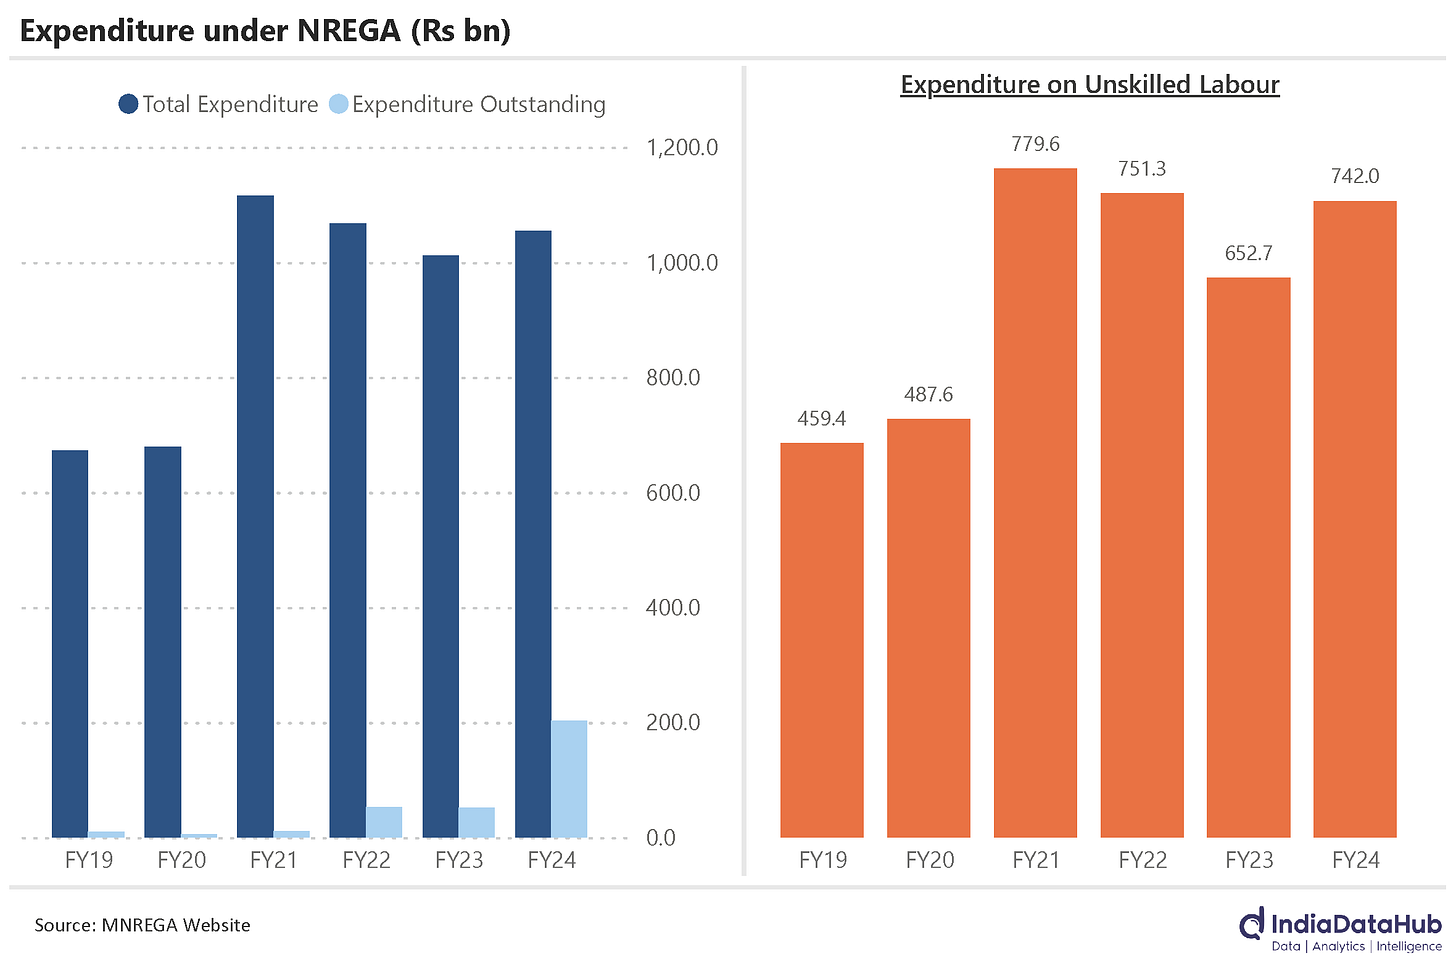
While neither the central nor the state governments are under any great fiscal stress, the NREGA scheme was in a deficit in FY24. While the total expenditure during the year was almost the same as last year at ~₹1050, the amount of unpaid expenditure (labour as well as material) rose sharply. As of the end of FY24, the scheme had an unpaid expenditure of ₹200bn, almost 4x of last year. Most of it is towards material and administration rather than wages. Effectively, the government has rolled over some of its FY24 liability to the next year.
That said, given that total expenditure paid during the year has increased modestly, on the flip side this means that the total amount of wages paid during the year (FY24) rose in double-digit terms. This was driven by a modest increase in the number of person-days generated under the scheme as well as an increase in the average wage rate per person-day.
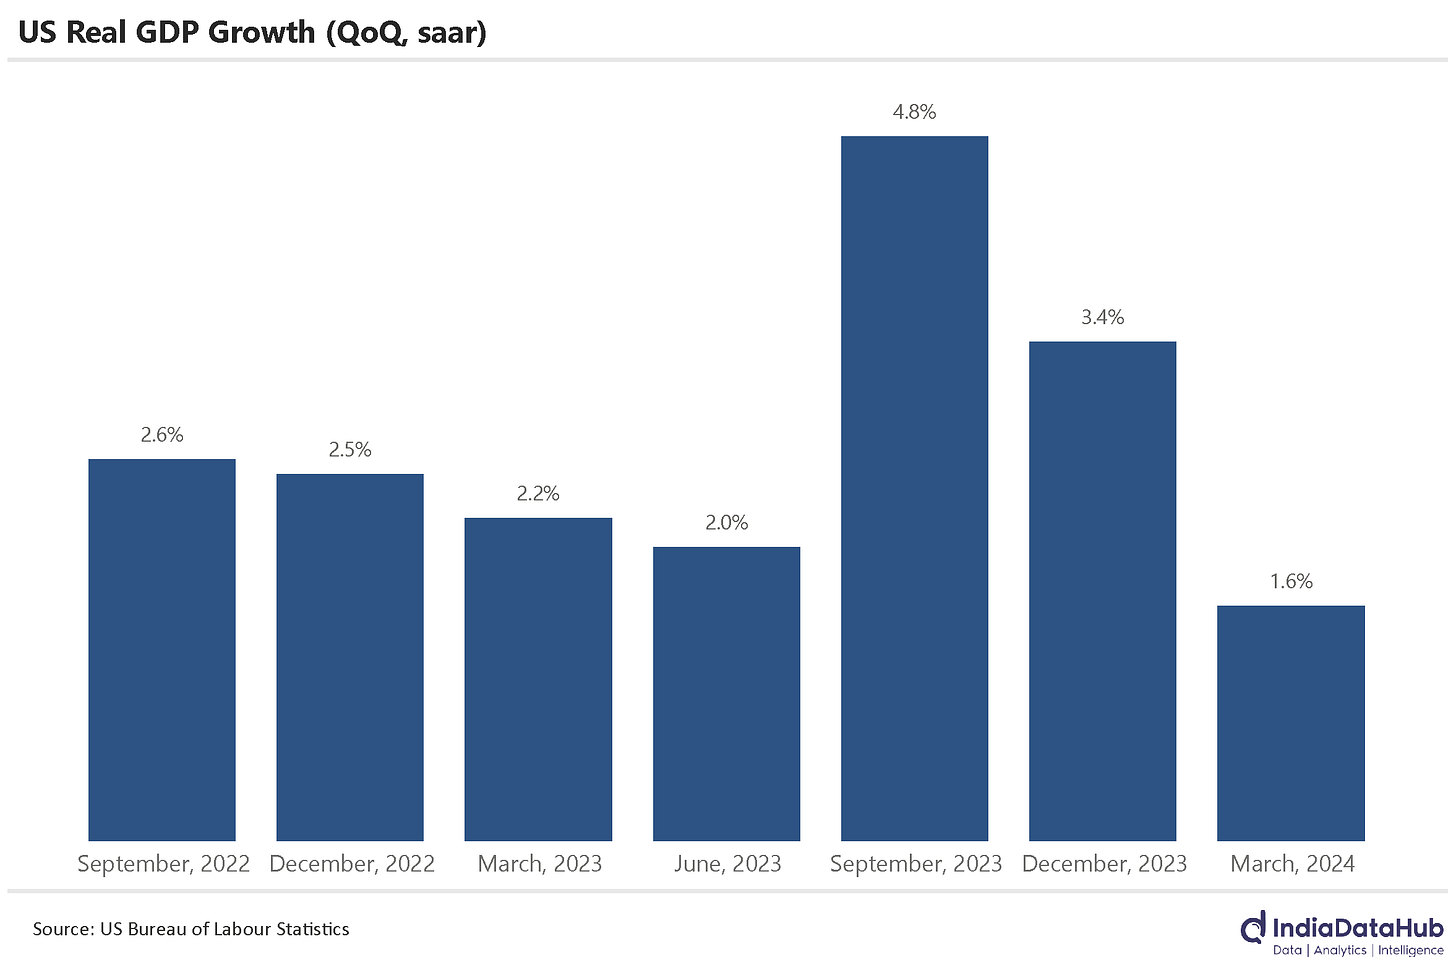
Ok, onto the rest of the world. A light week globally in terms of data. But the noteworthy release was the US 1QGDP which came in below expectations. US GDP grew 1.6% QoQ Saar during the March quarter as against an expectation of 2.5% growth. This is the slowest growth in the last 7 quarters.
Private Consumption saw a slowdown in growth and this was a key drag along with Government consumption. This was partially offset by a sharp increase in residential fixed investment (real estate). This will be slightly disconcerting but given that the labour market data remains strong, this is unlikely to by itself result in any immediate change in the US Fed’s rate trajectory.
That’s it for this week. Onto last week’s trivia. We had asked which item of men’s bottom wear has become more expensive in the last 5 years – was it the traditional wear like Dhoti or the modern or western wear like a trouser. And the answer is Dhoti – by a very small margin. In the last 5 years, as per the CSO, the price of Dhoti or Lungi has increased by 33% while that of trousers or shorts has increased by 31%.

