
Corporate profit cycle, Uptick in payments, growth in external borrowings and more...
This Week In Data #7
This Week In Day will now come to you every Friday evening. This gives you more time to read before markets open on Monday 😊
In this edition we cover
Corporate profit cycle
Recovery in payments data in Jan
Slight uptick in FDI
Pick up in external borrowings
In case you missed, we released a new dashboard this week that tracks high frequency data across the states. There are over a dozen indicators that you can track. Click here to see a quick overview...There have not been any key data releases this week, so we thought we will take a step back and look at a slightly different but very important topic – corporate profits. Corporate profits (and business profits in general) is a very important variable in any market-driven economy. If businesses are making profits, they will invest – in capacity and people – and if they are not making profits or making less profits, there is a tendency to cut costs which means less investments. So, what is the big picture for corporate profits?
A lot of people try to gauge corporate profitability by aggregating the listed companies or say a very large sample of 10-20k companies. But the Pareto in the case of corporate profits is not very high because of many profitable private limited companies for which data is not otherwise available. So, the best data set for aggregate corporate profitability trends comes from the tax authorities (in the budget) and is based on tax returns filed by the companies. The latest data is only till FY21, but the data is interesting.

So, the first year of the pandemic was very good for corporate profitability. Aggregate pre-tax corporate profits more than doubled YoY from ₹6,100bn to ₹12,700bn. Since nominal GDP declined slightly in that year, relative to nominal GDP, corporate profits rose to almost 6.5% of GDP. In the preceding 7 years, corporate profits had never crossed 6% of GDP. Economic activity was buoyant in FY22 as well and listed companies for which data is available had strong growth in profits. Thus, it is quite likely that corporate profits, relative to GDP, edged closer towards 7% in FY22.
However, even at ~7% of GDP, pre-tax corporate profits are lower than what they were a decade back – in FY12 they were 7.6% of GDP. And they will be less than half of the peak of the previous cycle – in FY08 corporate profits peaked at 14.5% of GDP. The fate of the bull market for equities, in a sense, hinges upon this one single metric. The bulls will argue that this is India’s moment under the sun and India’s economy will withstand the global headwinds and thus corporate profits will remain buoyant. Companies are done with their cost-cutting, capacity utilisation is now above average and as profits increase, they will invest in expansion which creates a positive feedback loop. With nominal GDP growing at 10-12% over the medium-term, overall corporate profits can easily compound in the high teens, if not more in this bull case. Equities ought to generally do well with this backdrop.
The bears will argue that the corporate profitability achieved just before the Global Financial Crisis (GFC) was a lot of froth for which the economy paid the price at the start of the last decade with the twin-balance sheet problem – over-leveraged corporates and highly stressed bank balance-sheets. The pre-GFC years had also seen a synchronised bull market across asset classes – Equities, Commodities and Property. And despite that inflation remained low allowing the liquidity environment to be benign. Things are dramatically different today with high inflation and global central banks eager to restore their credibility by tightening monetary policy to get inflation back down to acceptable levels. And thus, the bears will argue, we are never going back to those heady pre-GFC days.
To have a medium-term directional view on equities or the Indian economy for that matter necessitates knowing to which of the two camps above one has sympathies. So which camp do you belong to?
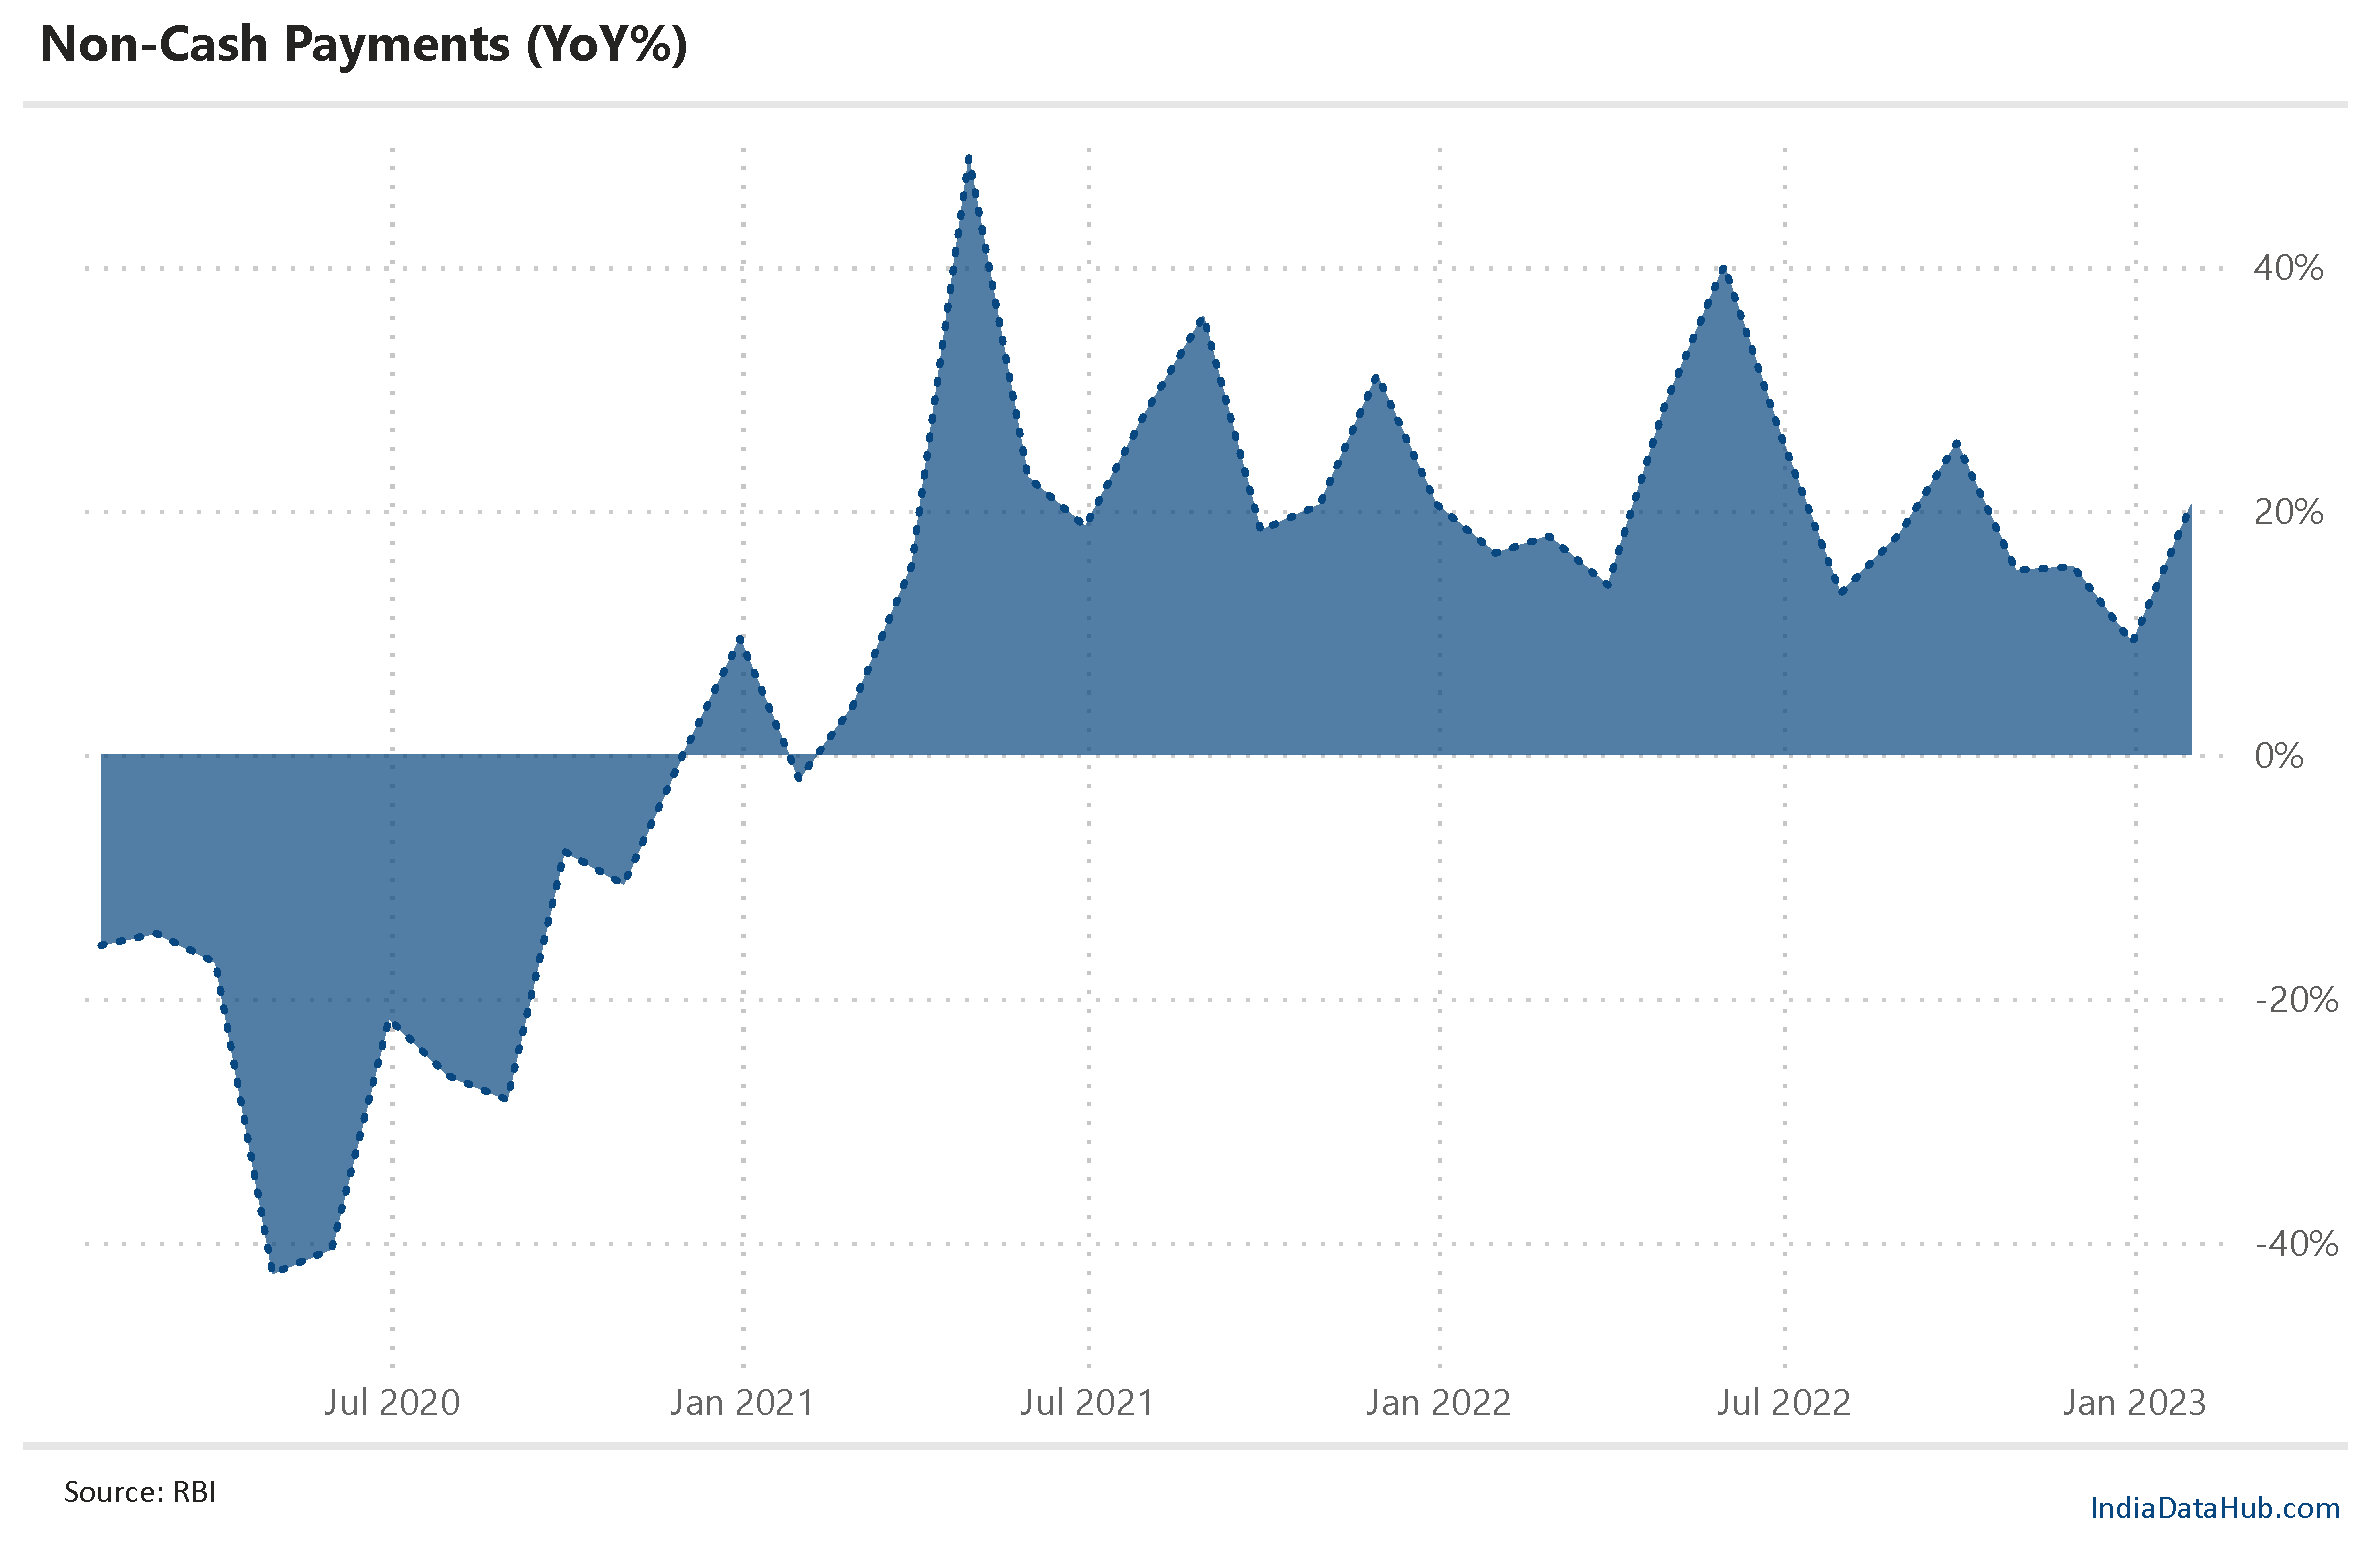
We did get some data releases this week. The more relevant among them was the payments data for January. And like with other high-frequency data, that too reversed the decelerating trend till December. Overall payments grew 20% YoY in January, the highest in the last 4 months. To some extent this uptick reflects the base effect – last year January had seen the short-lived and last of the Covid waves (Omicron). If the uptick is almost entirely due to this base effect, it will peter out in February and March. The MPC in any case will have data for both February and early data releases for March when it makes its rate decision in April. So, the January data is not going to matter a lot.
The RBI released preliminary FDI data for December. Gross FDI inflow picked up in December to a 5-month high and was also higher on a YoY basis. That said, YTD (Apr-Dec) FDI into India continues to run ~10% lower on a YoY basis. This would have been worrying but for the fact that, as we discussed last week, sequentially the trade deficit has declined. So, the requirement of capital flows to fund the external gap has correspondingly seen a reduction.
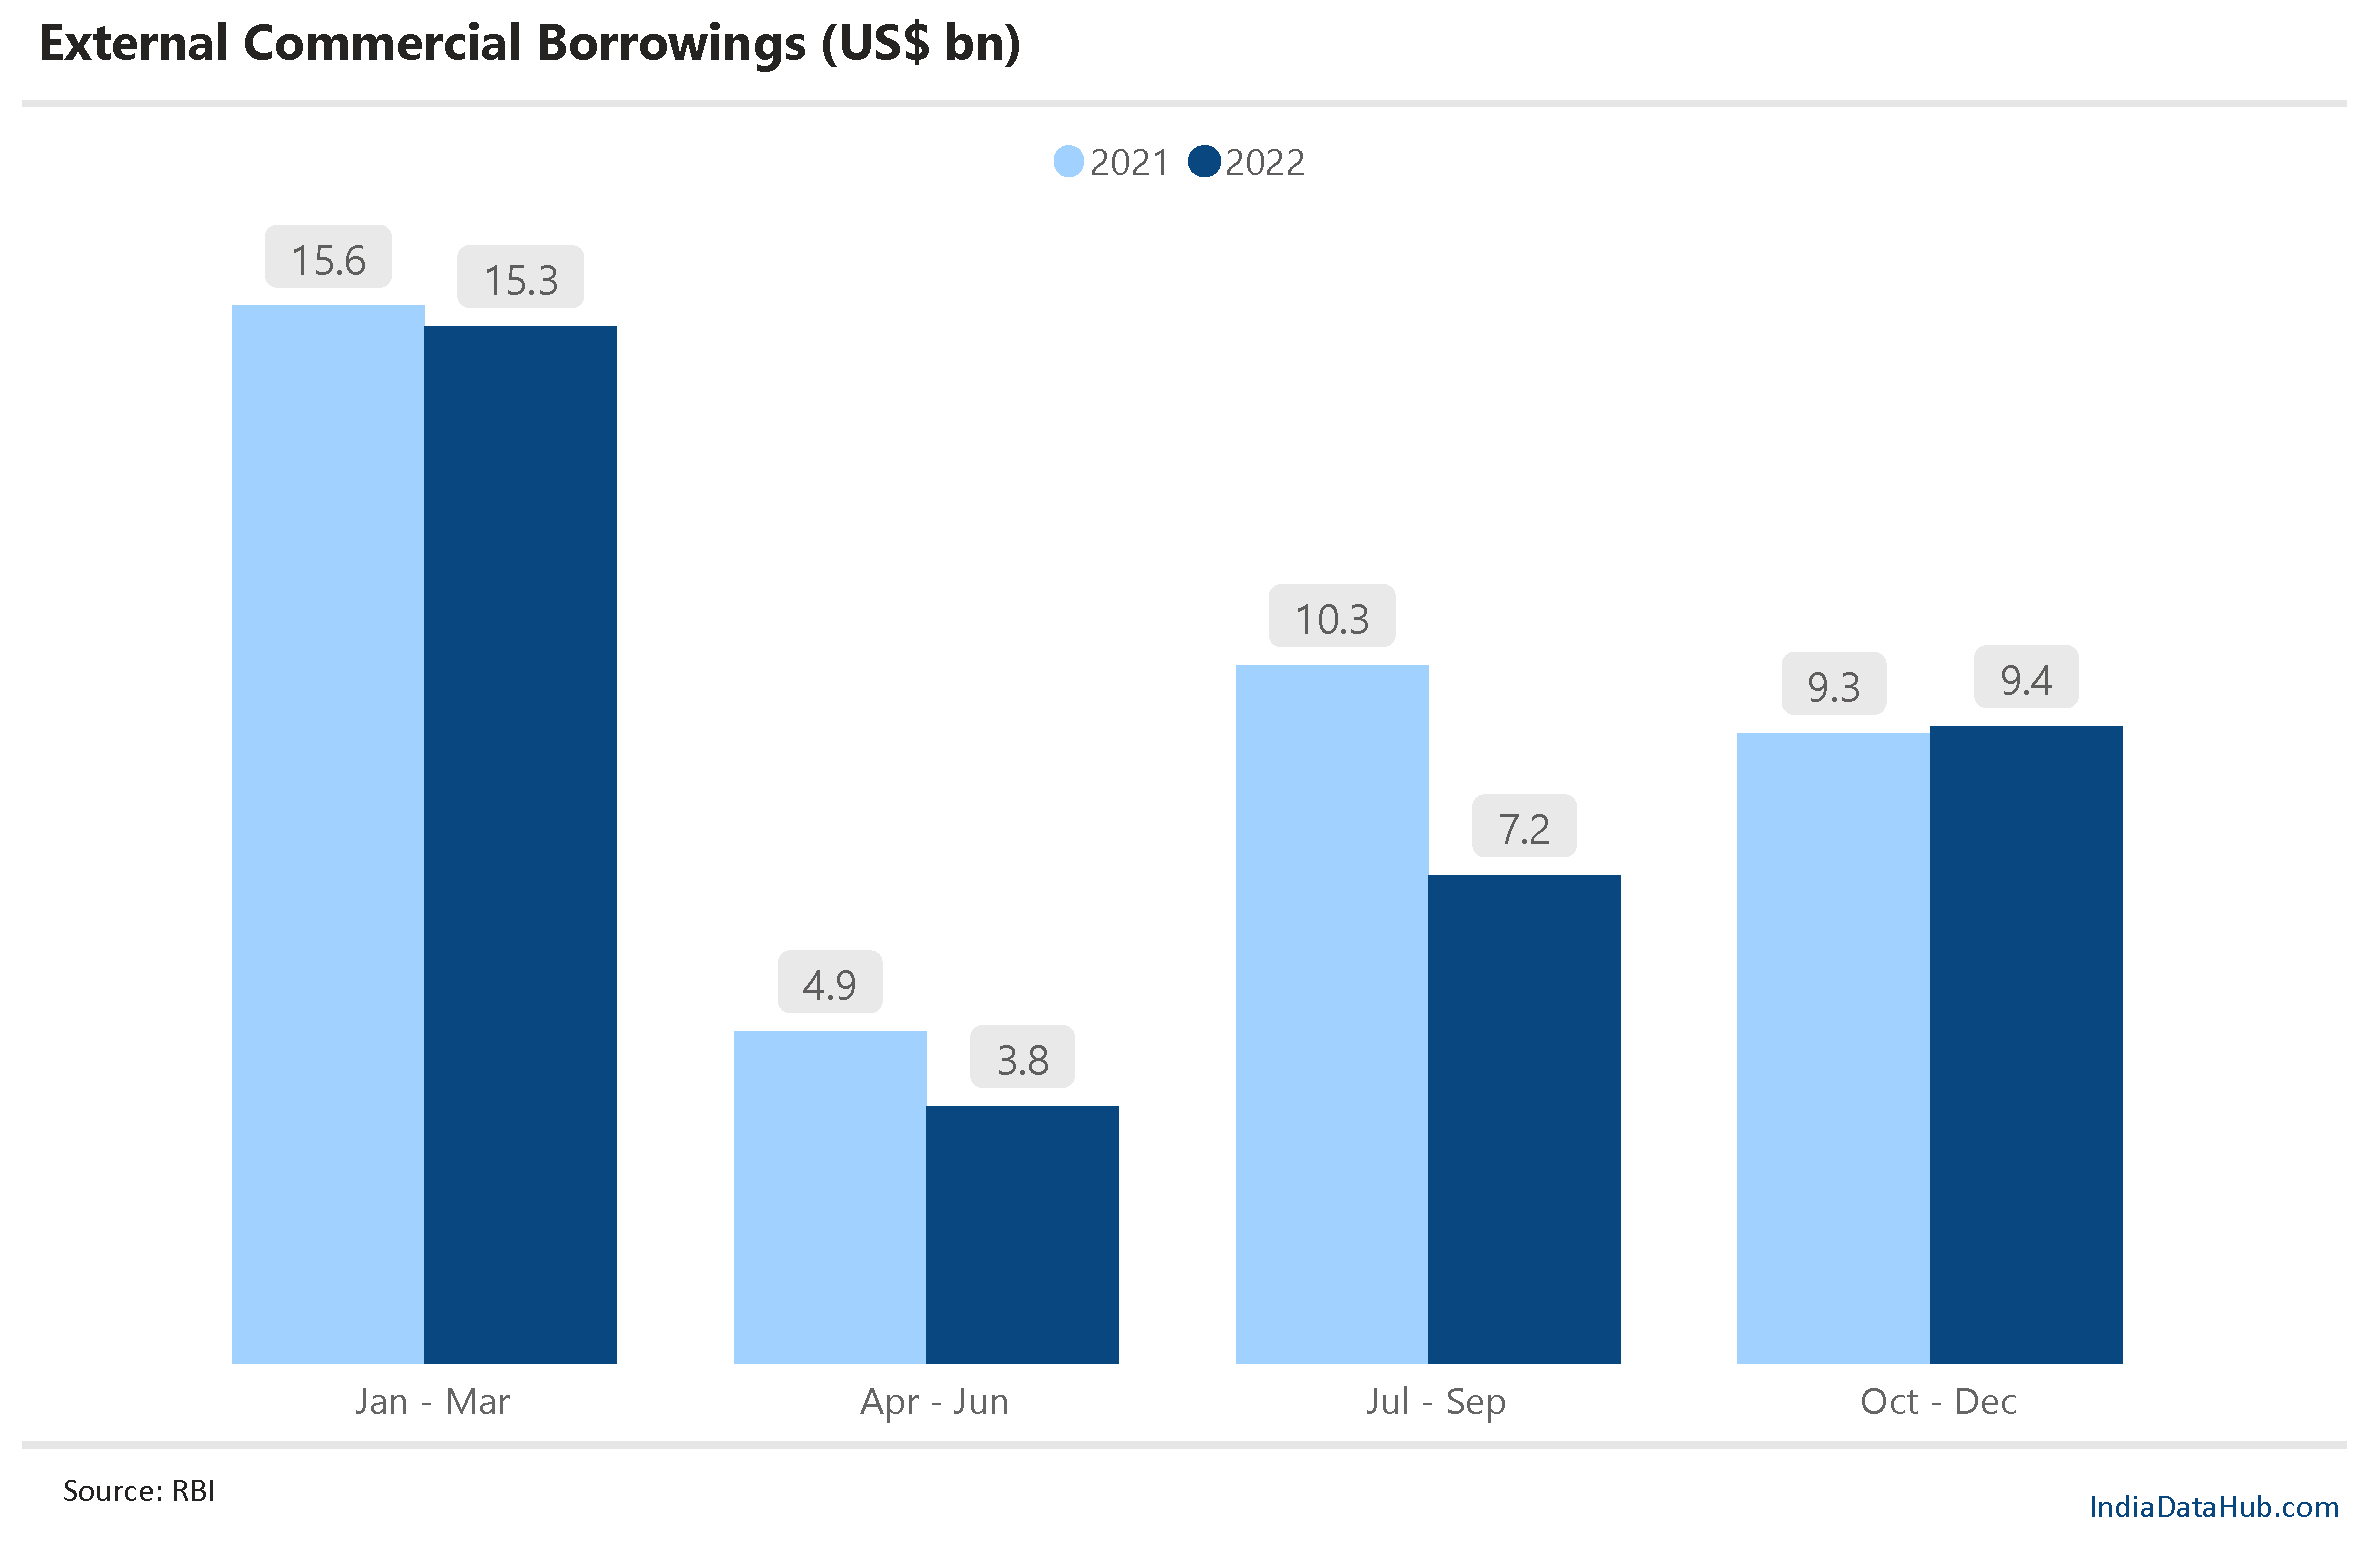
Lastly, external credit markets are opening up again. Approvals for External Commercial Borrowings (ECBs) by the RBI had been decreasing through most of the calendar year 2022 due to rising global interest rates. But in the last quarter of 2022, ECB approvals were slightly higher than a year ago – they had declined over 20% YoY in the preceding 2 quarters. So, the availability of credit for Indian corporates has improved slightly.
That’s it for this week. Next week will be very data-heavy with end of month data and start of the month releases. We will thus resume the usual rigmarole of monthly high frequency data updates.