
Exports decelerate, MF Cash holdings decline, China Trade and more...
This Week In Data #152
In this edition of This Week In Data we discuss:
India’s trade deficit widens over 20% YoY in December as export growth decelerates
Exports to USA still holding up with just 2% decline in December
Aggregate cash holdings of equity funds has gradually declined with Small cap funds seeing amongst the largest decline
Domestic coal production sees a pick up with dispatches to non-power sectors seeing strong growth
China’s exports continue to grow despite decline in exports to the USA
US Inflation remains sticky complicating the task for the Fed
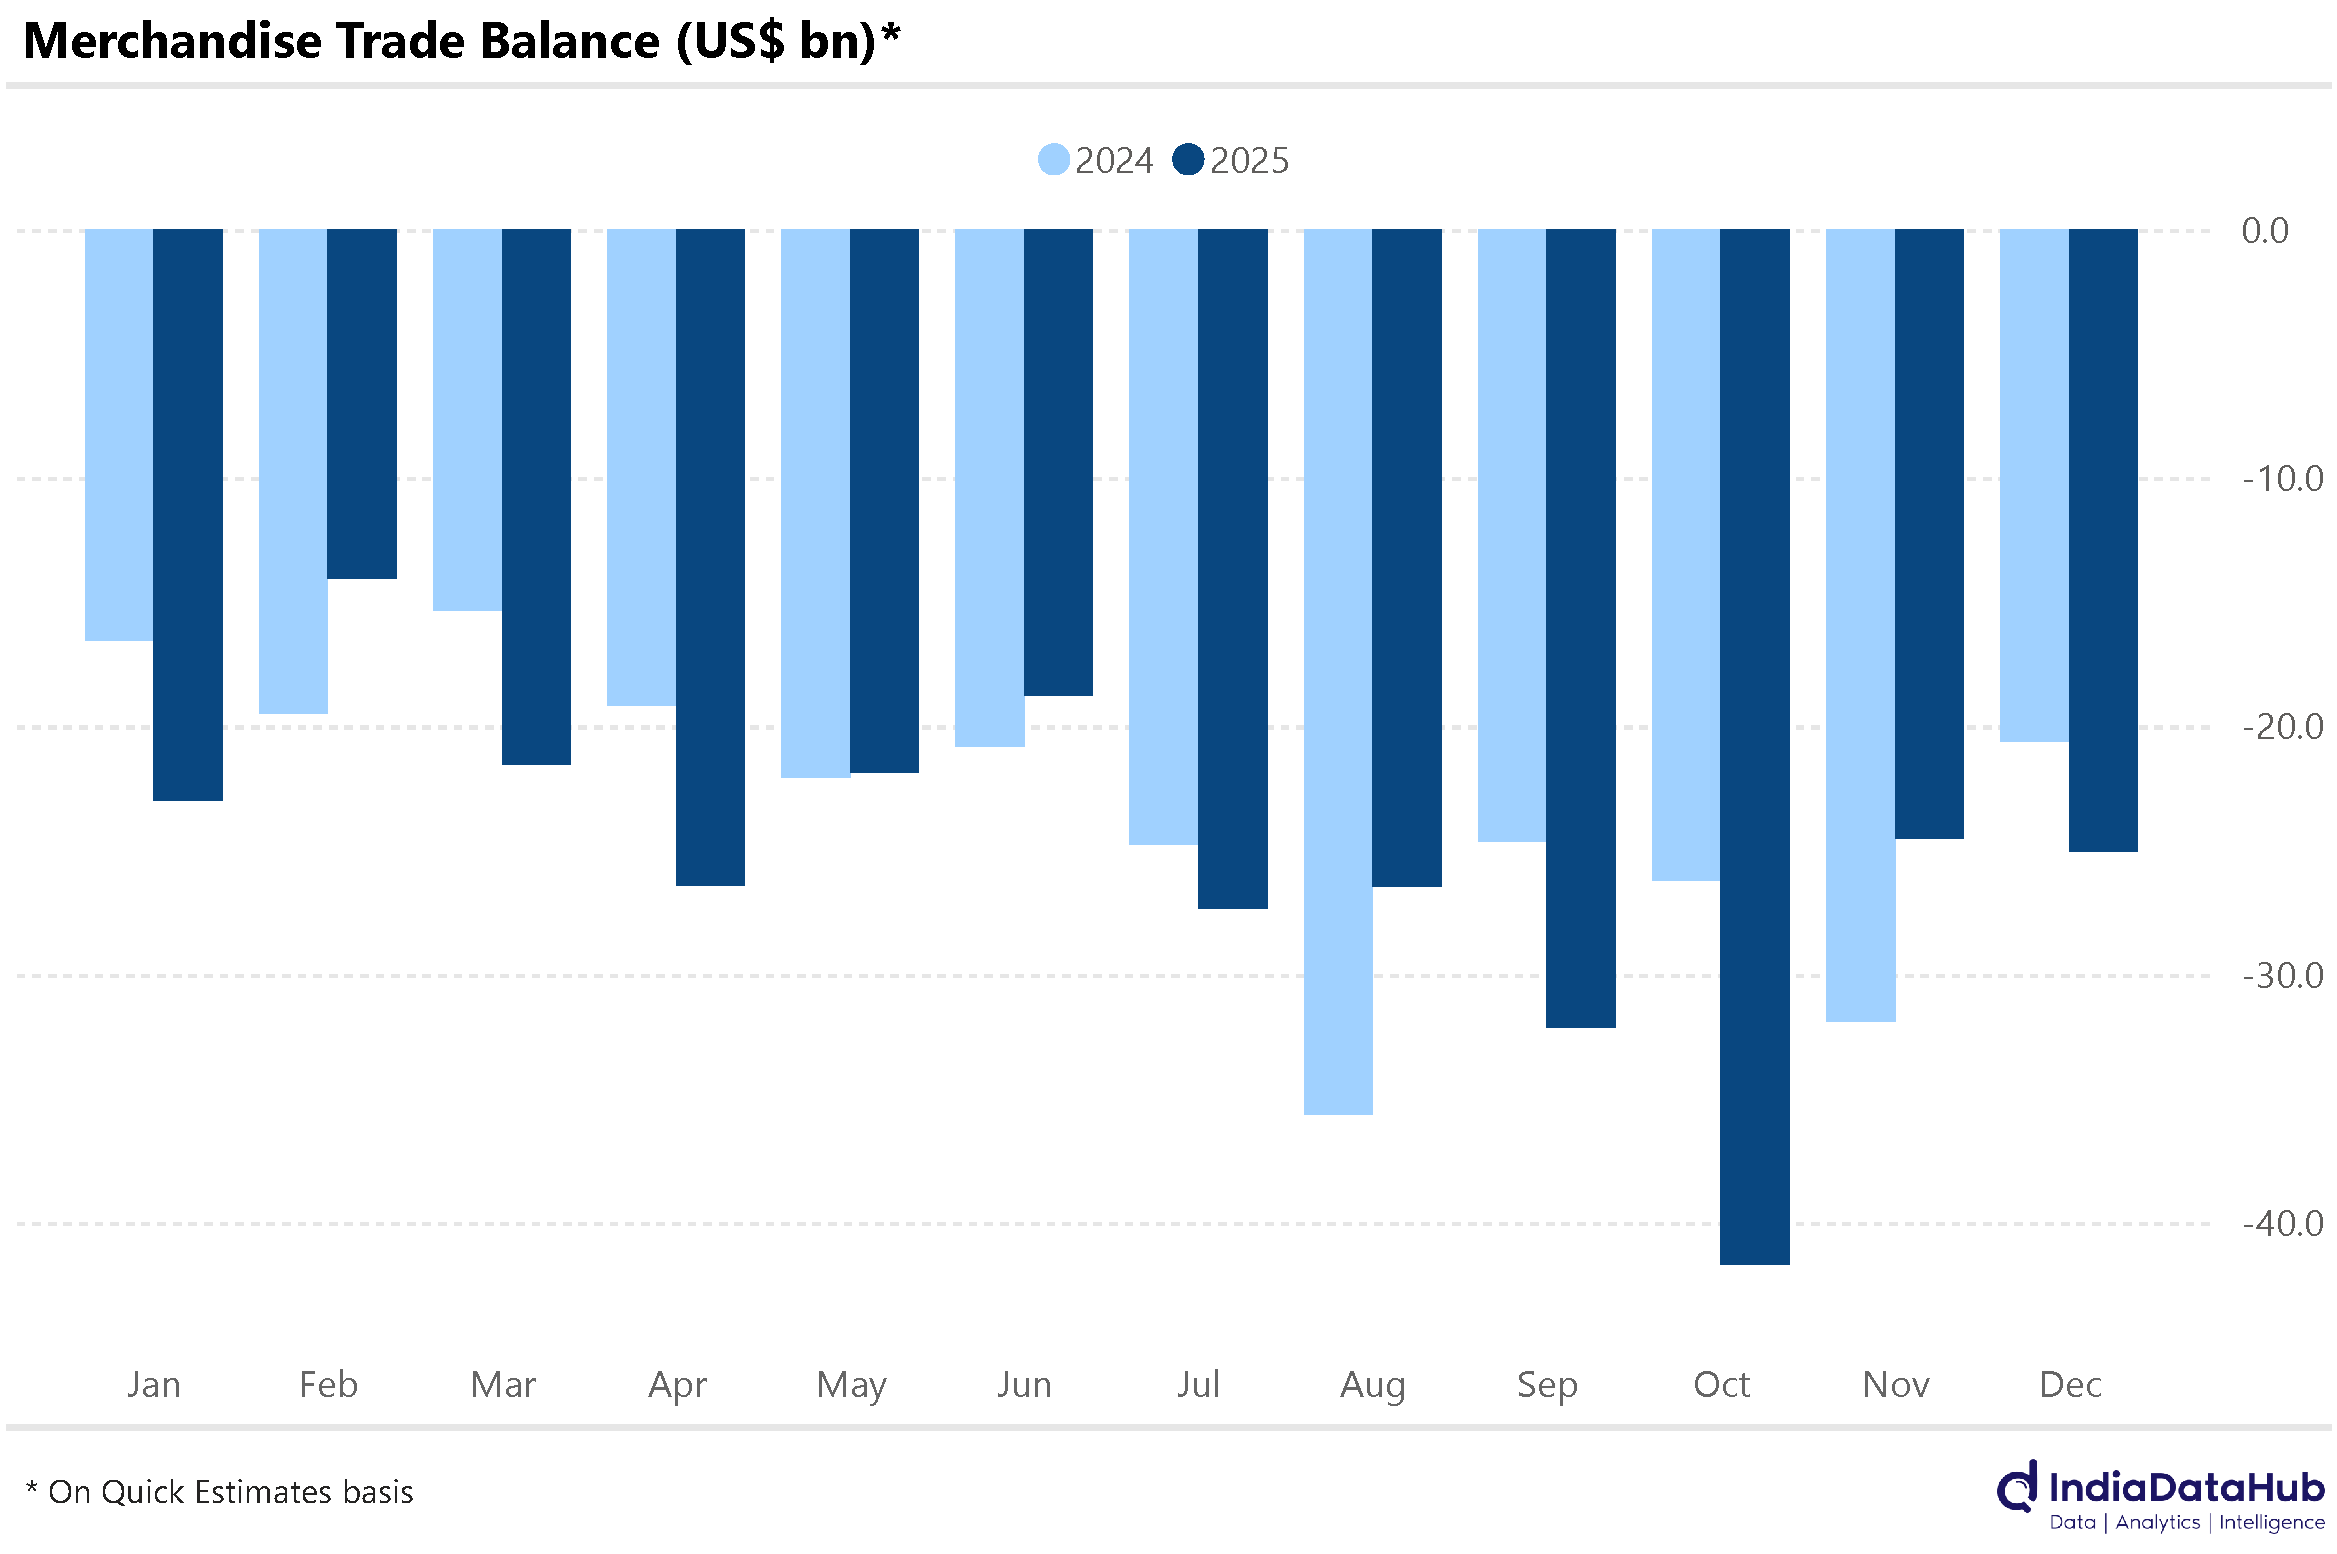
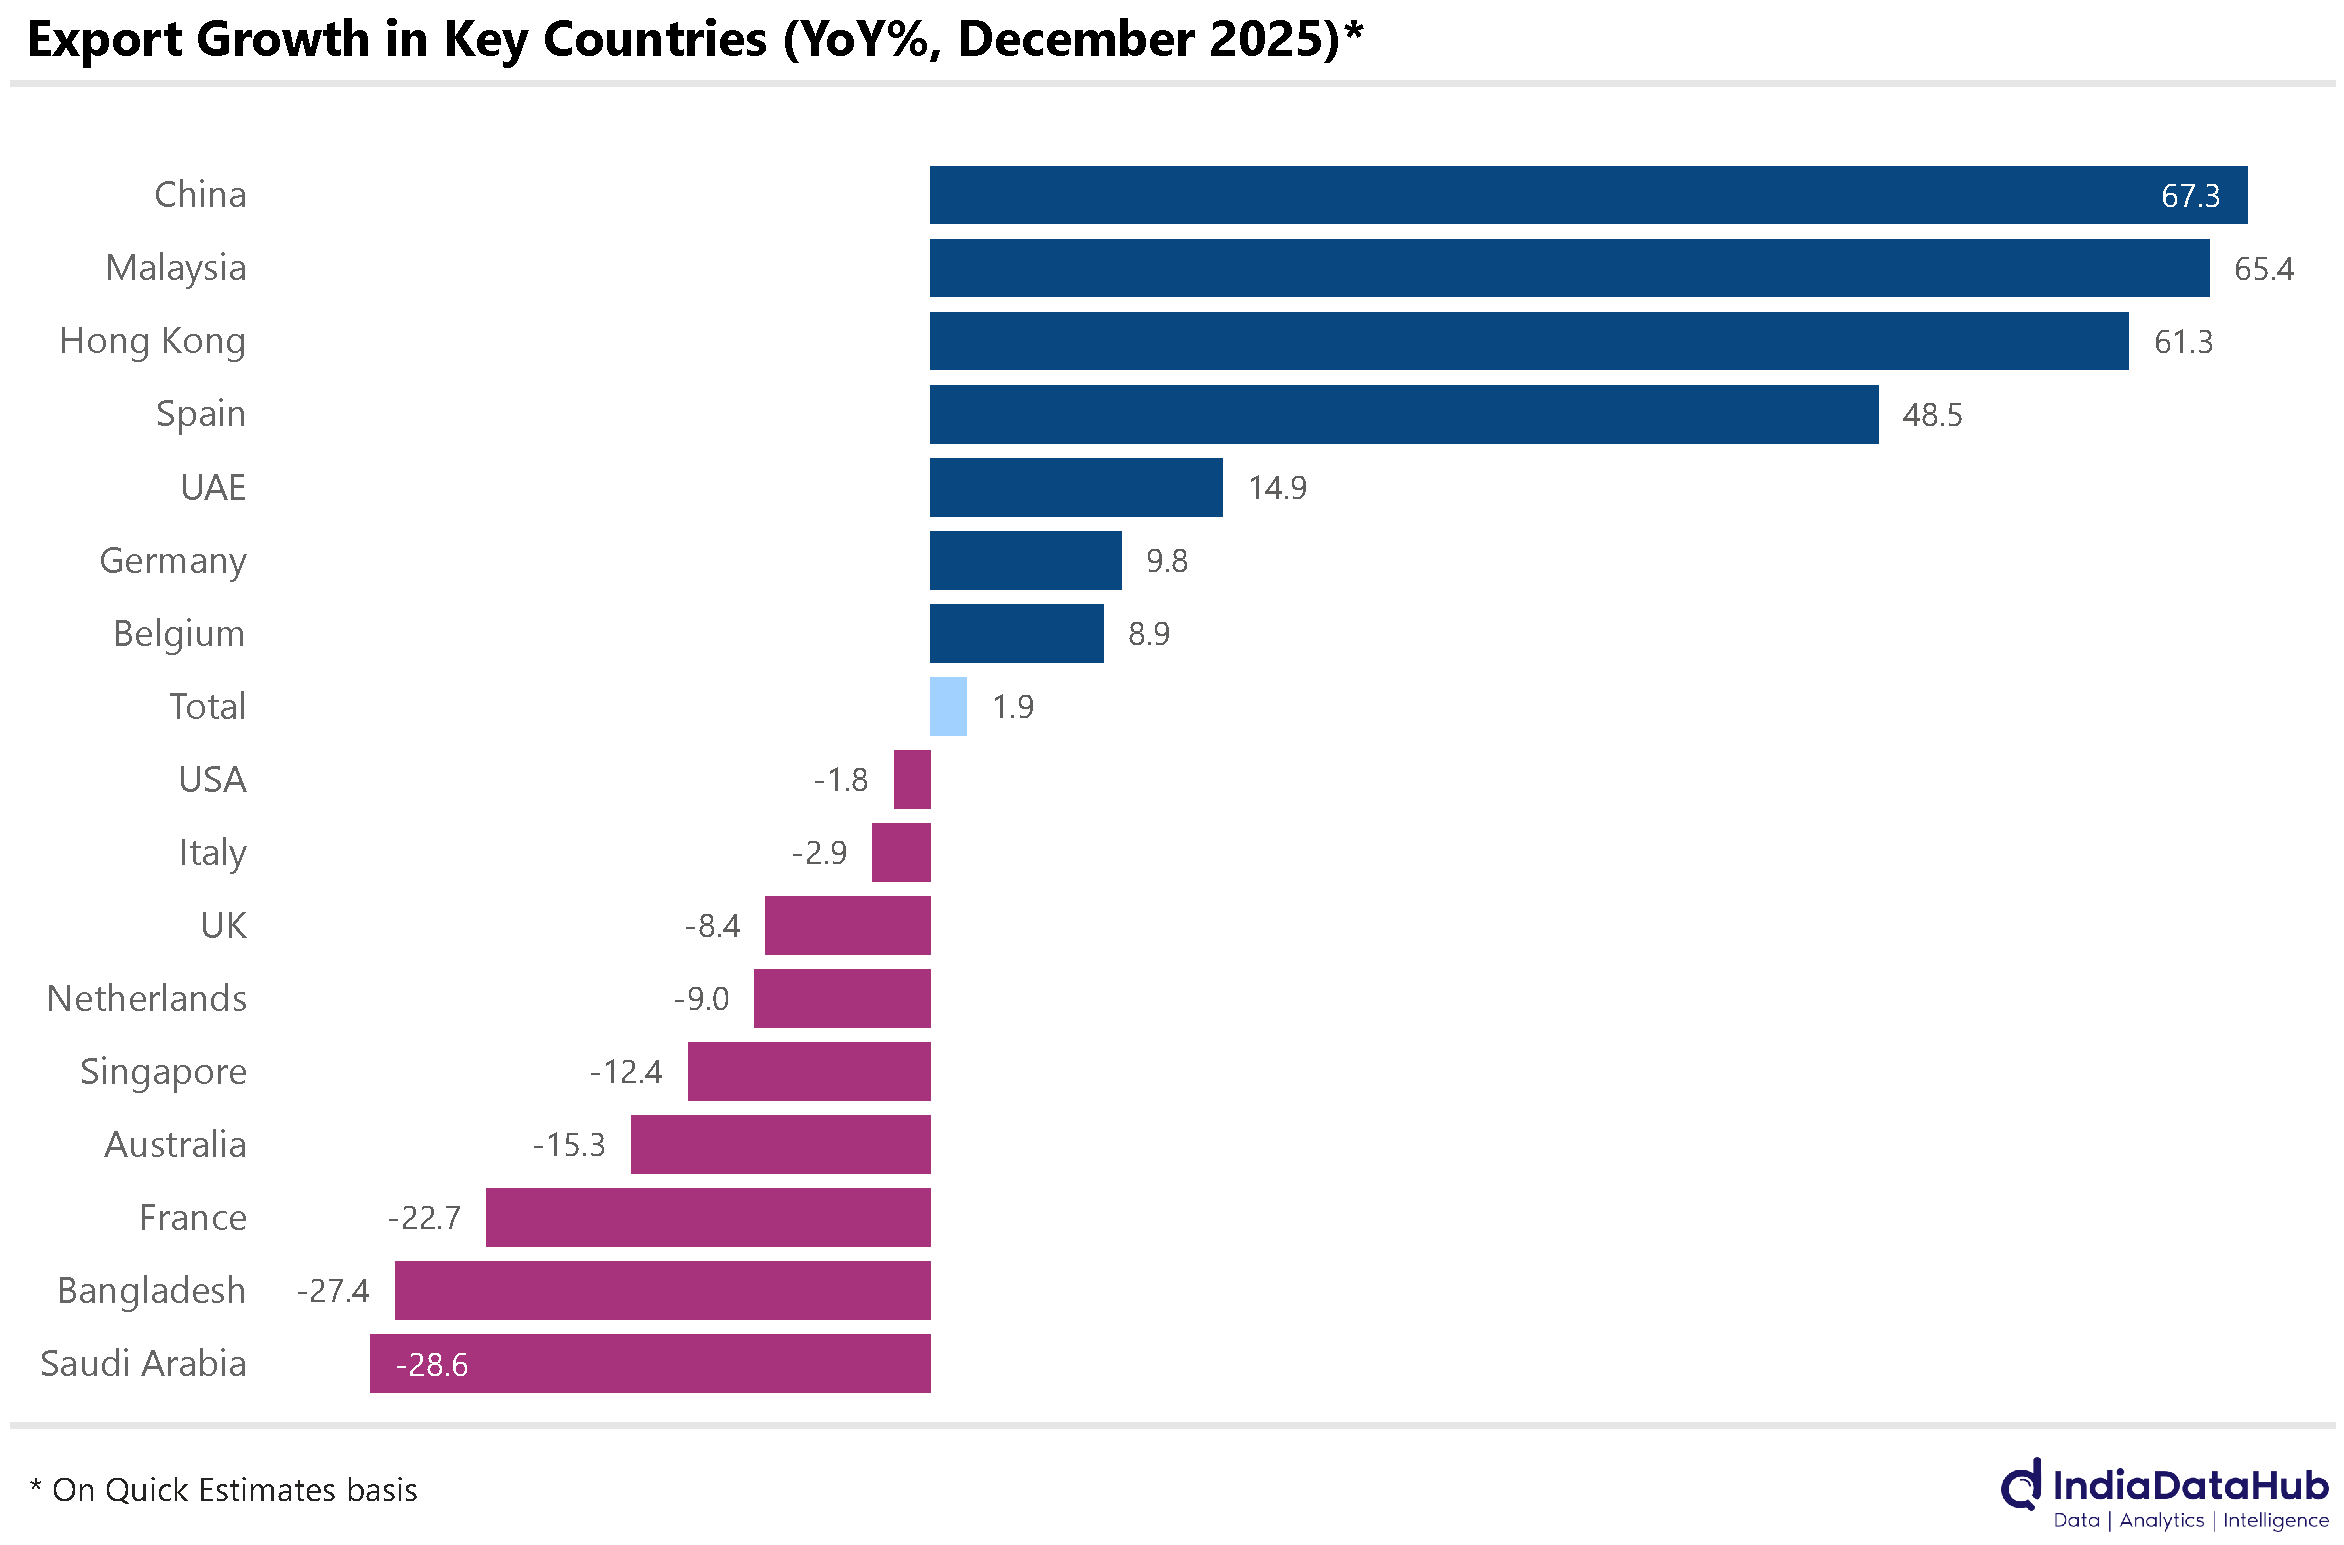
In case you missed, we introduced Trade DB, a separate section to track detailed trade data right down to individual 8-digit HS Code level. You can filter this by imports and exports as well as by value and quantity. In addition, you can now track detailed trade data across over 175 categories and subcategories for all key India’s trade partners (over 65 of them!). For more click hereIndia’s merchandise trade deficit declined 21% YoY in December to US$25bn as export growth decelerated sharply to just 2% YoY, the lowest in the last 5 months. Europe was the big drag on exports in December – the UK, Netherlands, France all saw sharp decline in exports. Exports to Singapore and Saudi Arabia also declined sharply. However, despite the tariffs, exports to the USA dropped by just 2% YoY. This decline was, however, more than offset by continued strong growth in exports to China (+67%), Hong Kong (+61%) and the UAE (+15%).
What is worth noting is that despite the tariffs kicking in from August, exports to the USA have grown by almost 10% YoY between April and December due to the front-loading of exports in anticipation of the tariffs in the first half of the year. And given the current run rate, exports to China will likely cross US$20bn for the full year FY26, making China the third largest export destination for India after the USA and the UAE, overtaking the UK and the Netherlands!
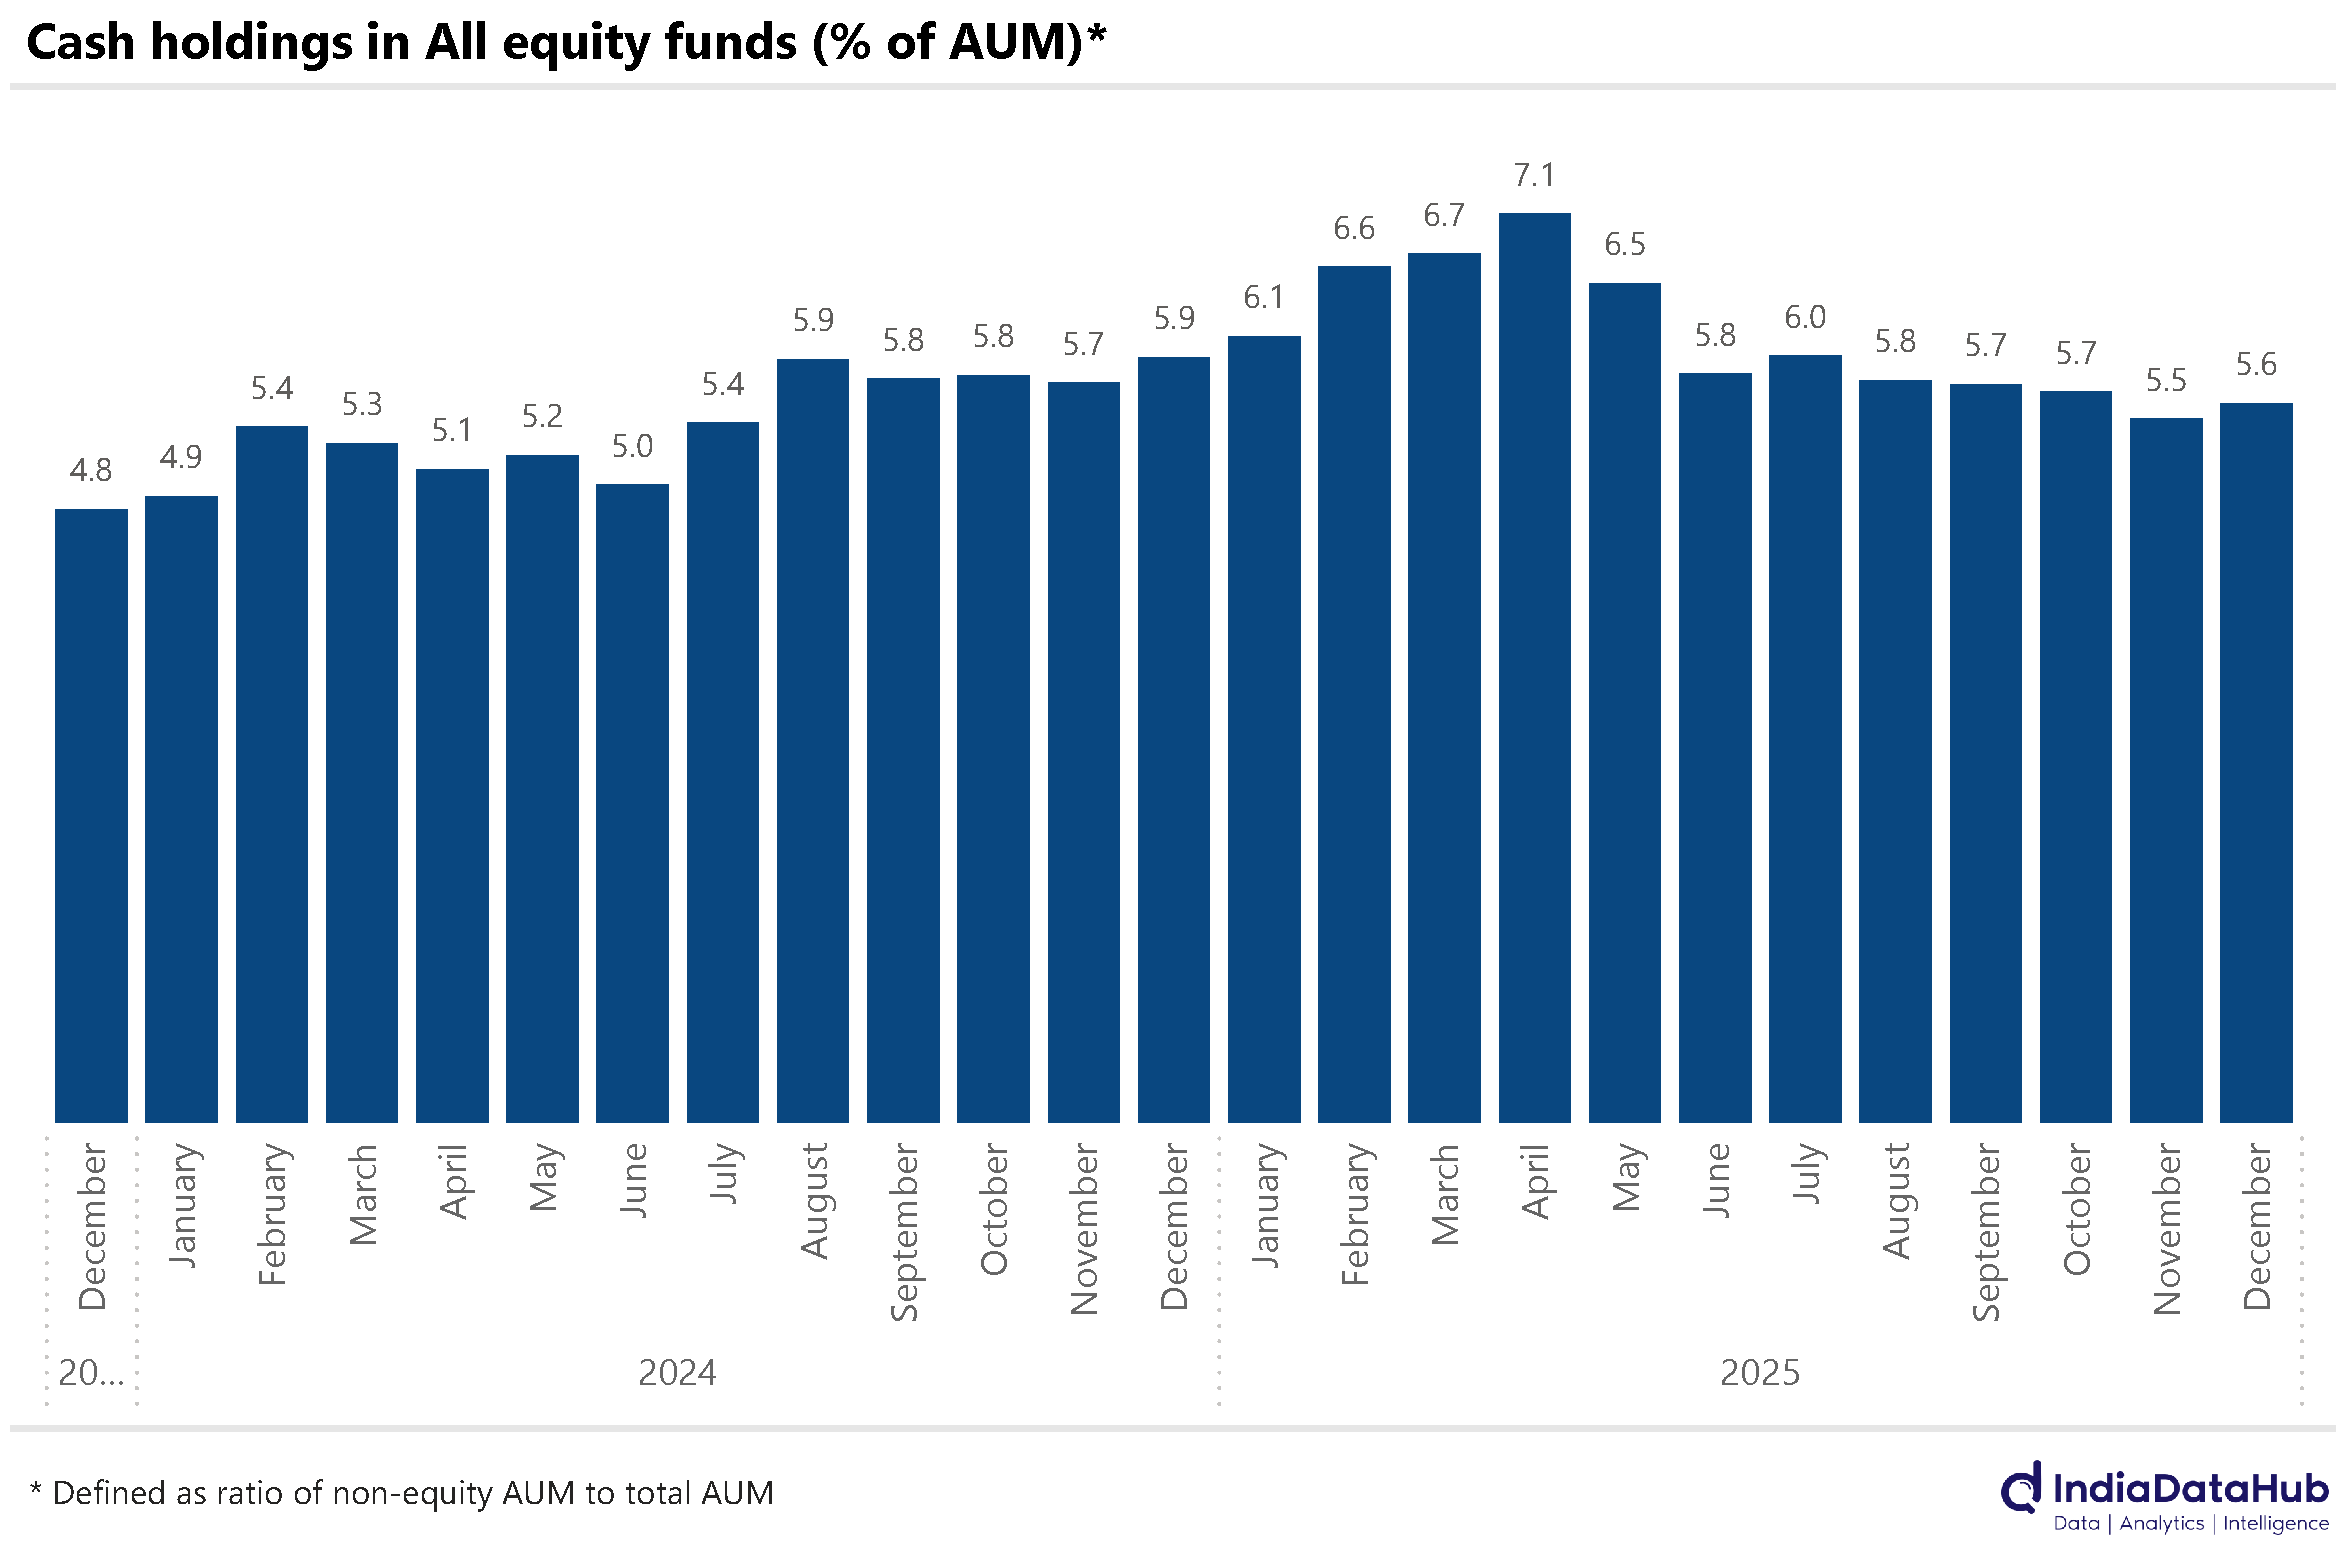
Aggregate cash holdings of domestic equity mutual funds has steadily dropped through the second half of 2025 from a high of 7% in April 2025 to ~5.5% of AUM towards the end of the year. At this level, cash holdings are the lowest since the first half of 2024, when they were around 5% of AUM.
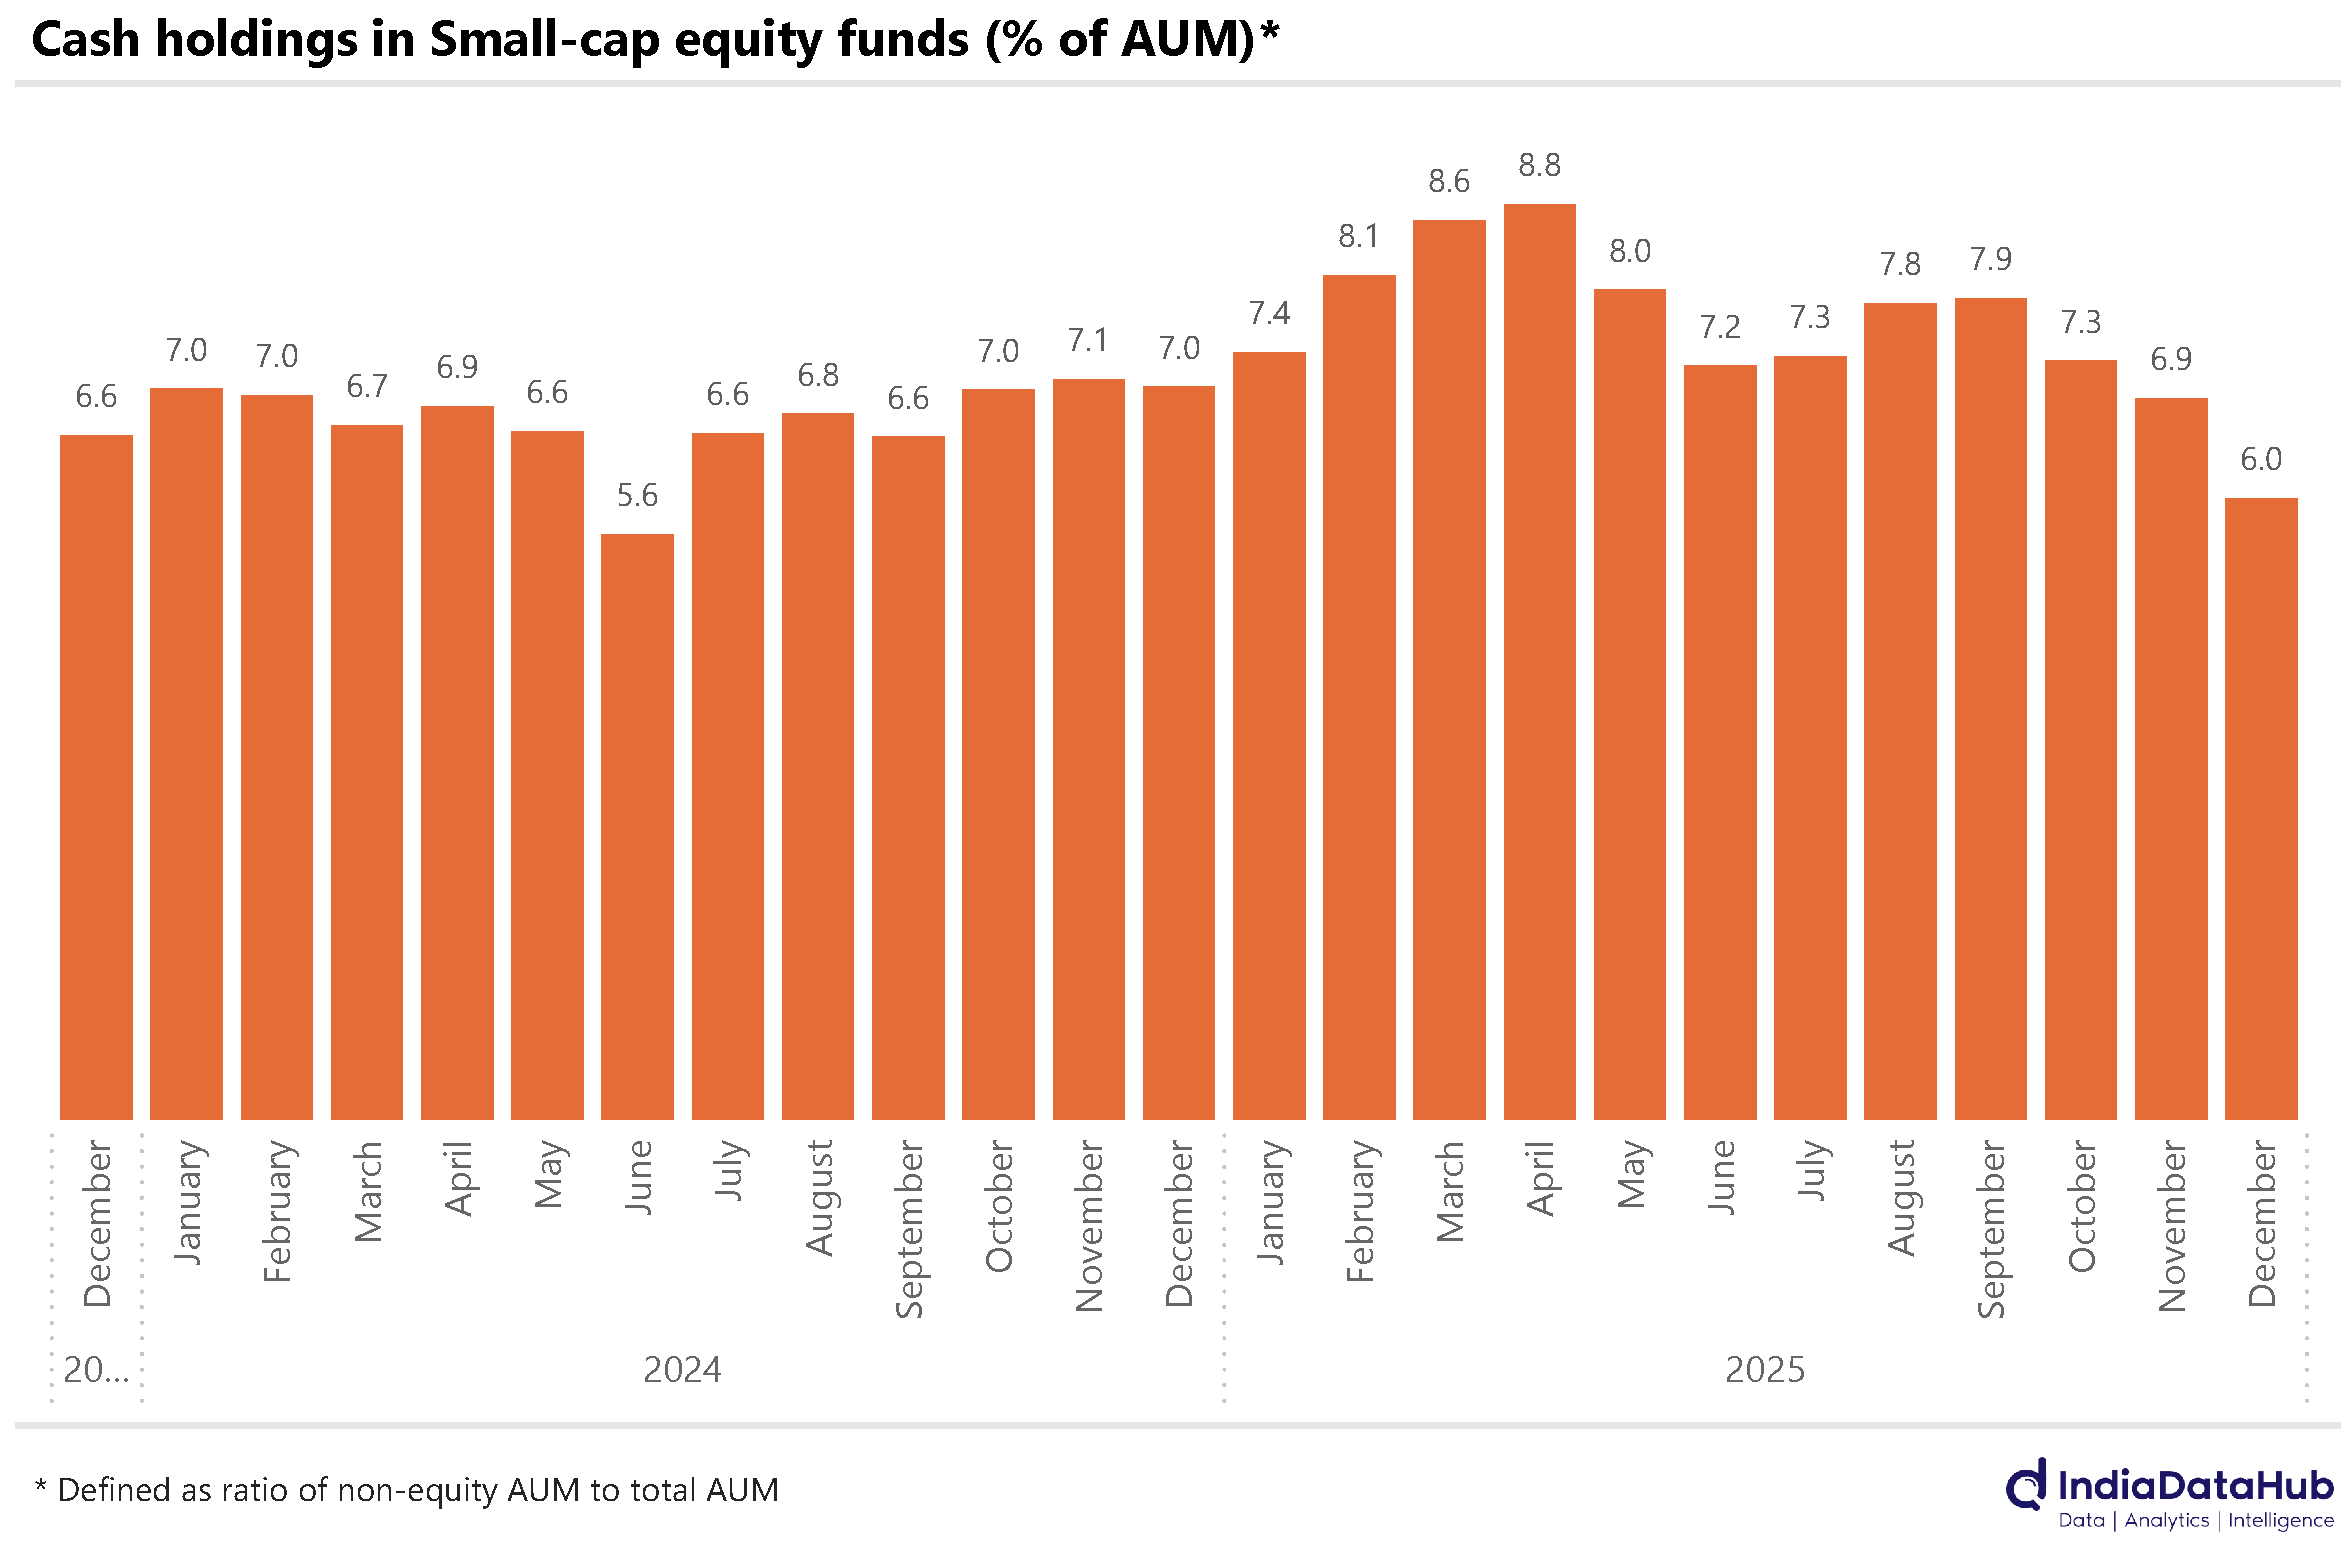
The decline, though, is not across all fund categories. Both Large and small-cap funds have seen sharp declines in cash levels. Large-cap funds held ~3.9% of their AUM in cash, down 2ppt from April 2025 when cash holdings had totalled ~6% of AUM. Cash holdings in large-cap funds is the lowest since June 2024. And for the small-cap funds, the decline is even sharper - from almost 9% of AUM in April 2025 to just under 6% as of December. And at below 6% cash levels at small-cap funds is the second lowest in the last 2 years, the lowest being in June 2024 at 5.6%.
If the level of cash holdings reflects the optimism or otherwise of equity fund managers, then this decline in their cash holdings does suggest that fund managers, on balance, have become more optimistic about the equity market performance over the next few months. We shall see!
Domestic coal production grew 3.6% YoY in December, the strongest growth in the last 7 months. However, dispatches to end users declined 2.7% YoY. This was largely due to the decline in dispatches to power plants – thermal power plants saw their 4th consecutive month of decline in coal dispatches, with December seeing a 9% decline.
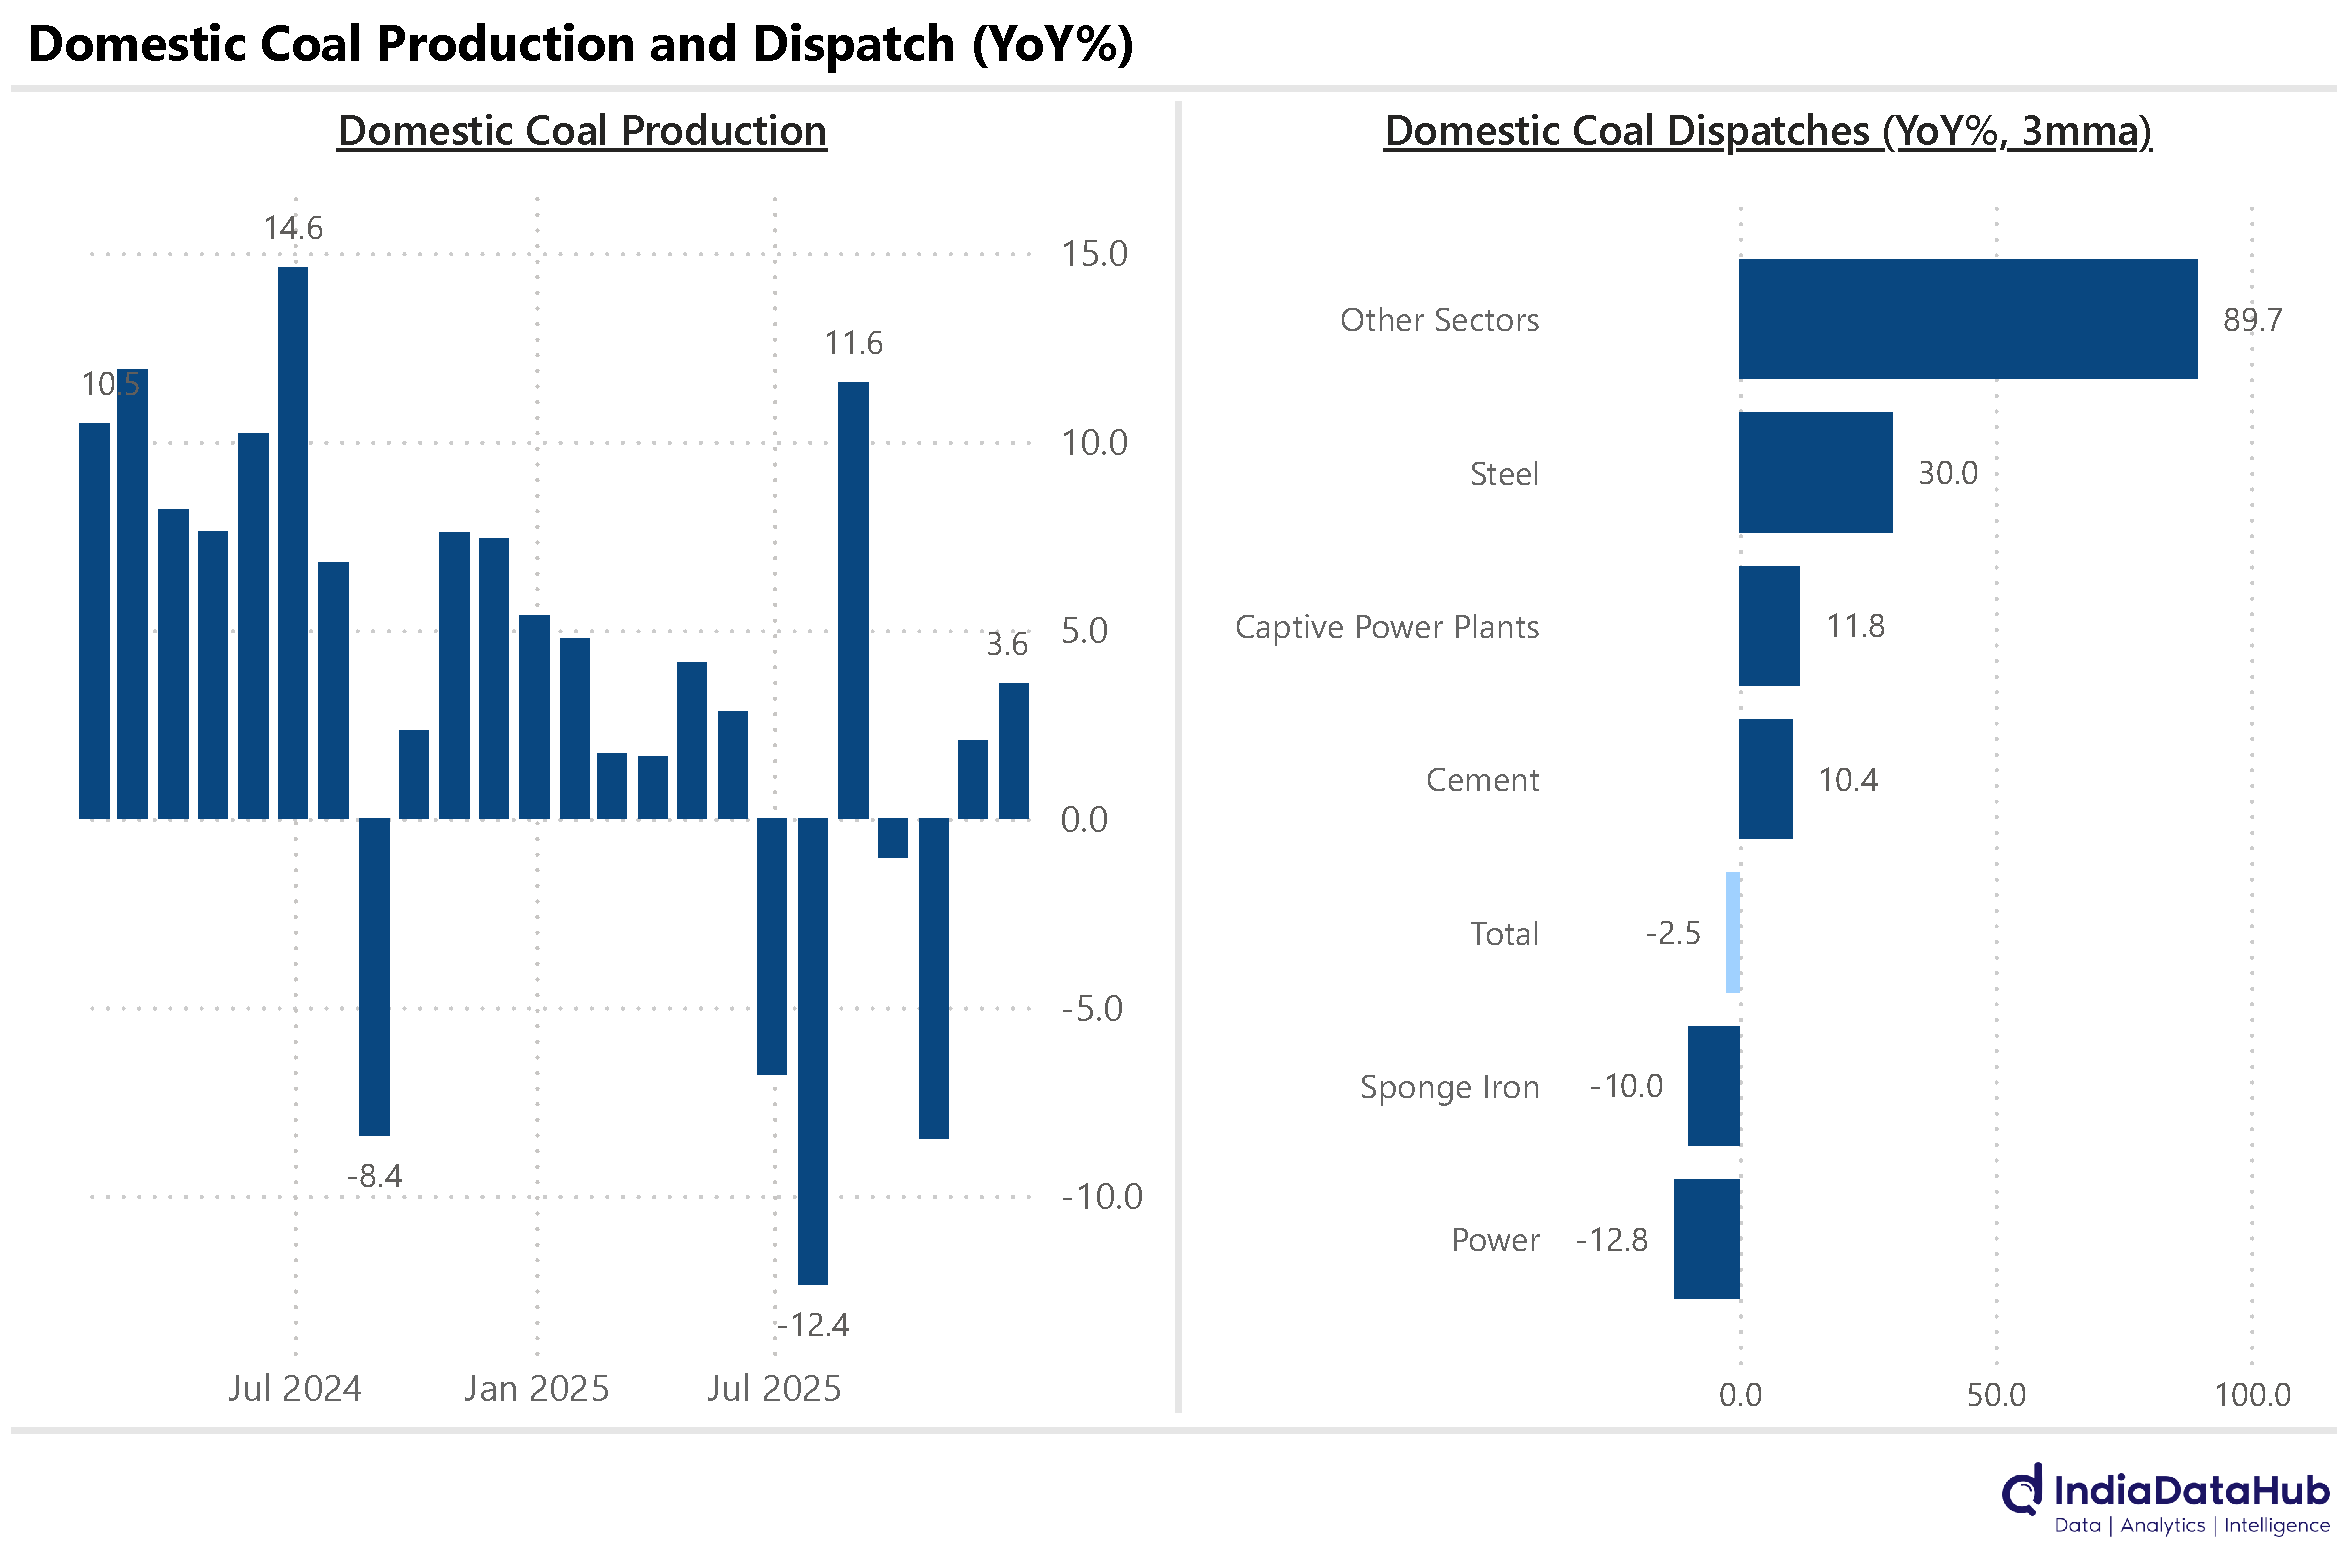
This, though, was offset partially by a sharp growth in dispatches to the Steel and Cement sectors. Dispatches to Steel mills, for instance, almost doubled on a YoY basis in December and has grown at an average of 30% over the past 3 months while those to Cement plants have increased by over 10% YoY in the last 3 months. Captive power plants have also seen double digit growth in coal dispatches over the past 3 months. Is this a marker for strong industrial growth in the ensuing months?
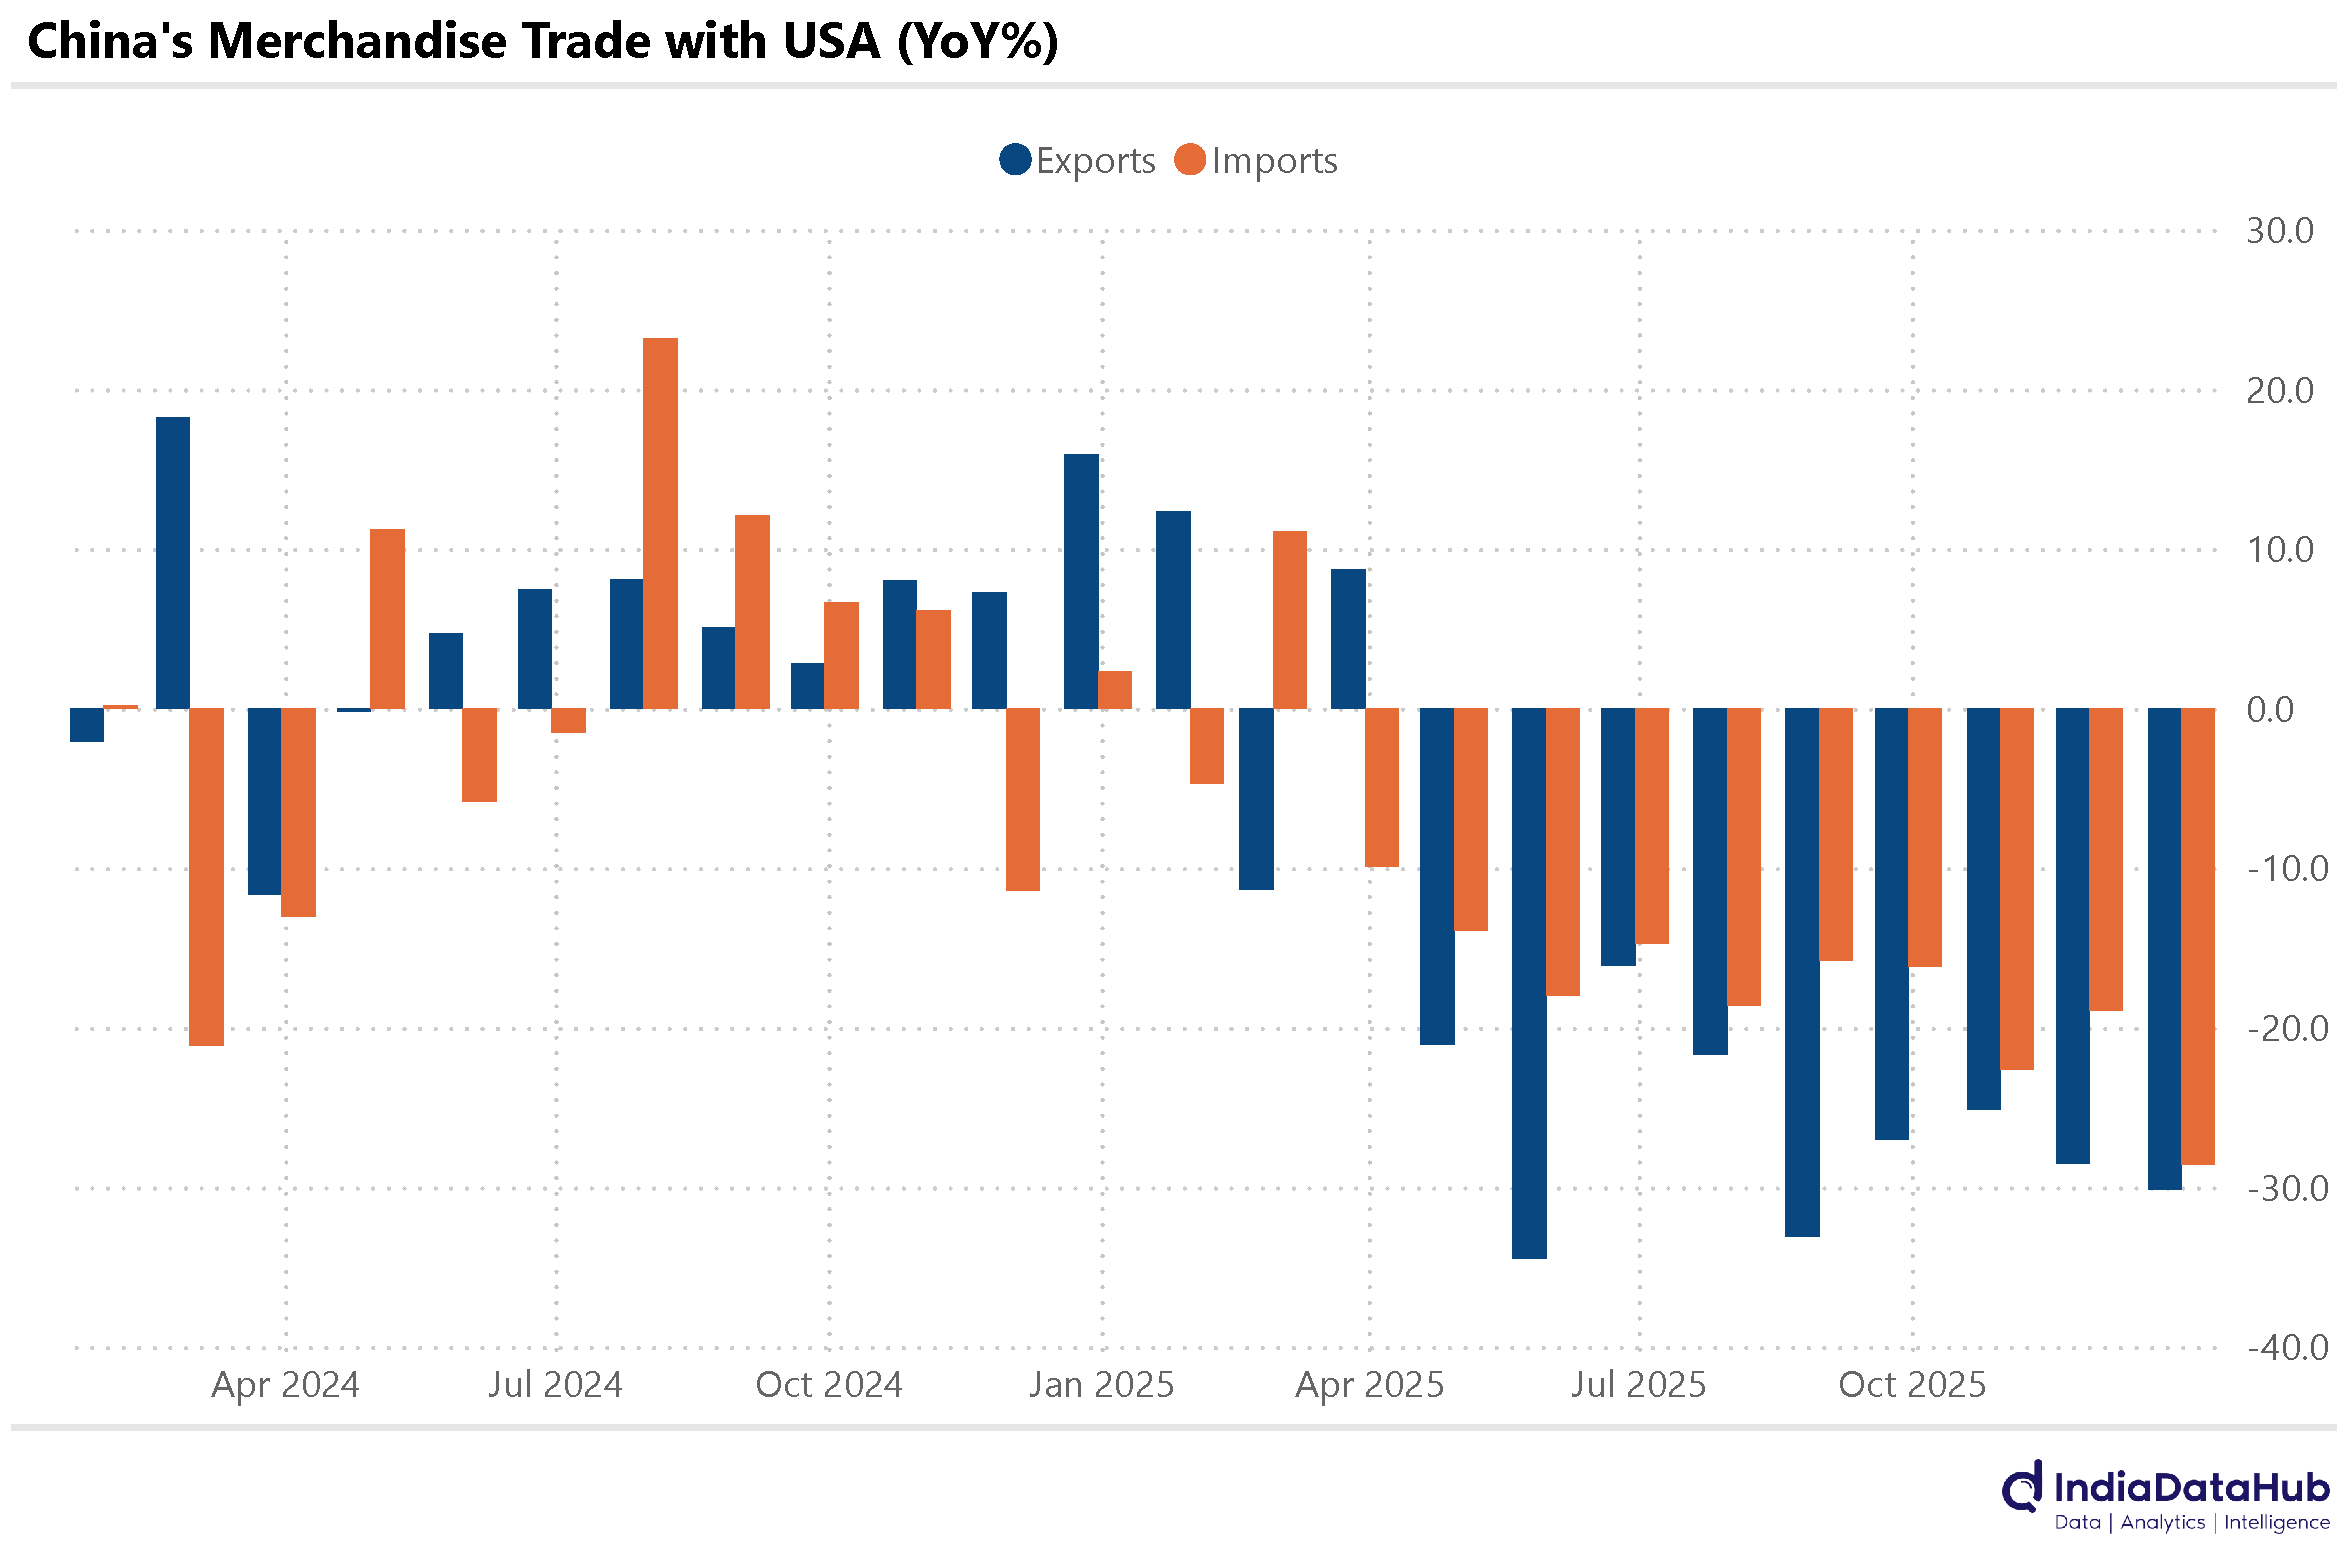
China recorded a monthly (goods) trade surplus of US$114bn in December 2025, the highest in the past six months, as exports rose faster than imports. Exports rose by almost 7% YoY in aggregate despite a 30% decline in exports to the USA.
China’s exports to the USA have now declined for 9 consecutive months. However, higher exports to the EU and the Southeast Asian countries offset the drag from the lower exports to the USA. China’s total imports, rose by 6% YoY in December despite a similar ~30% decline in imports from the USA.
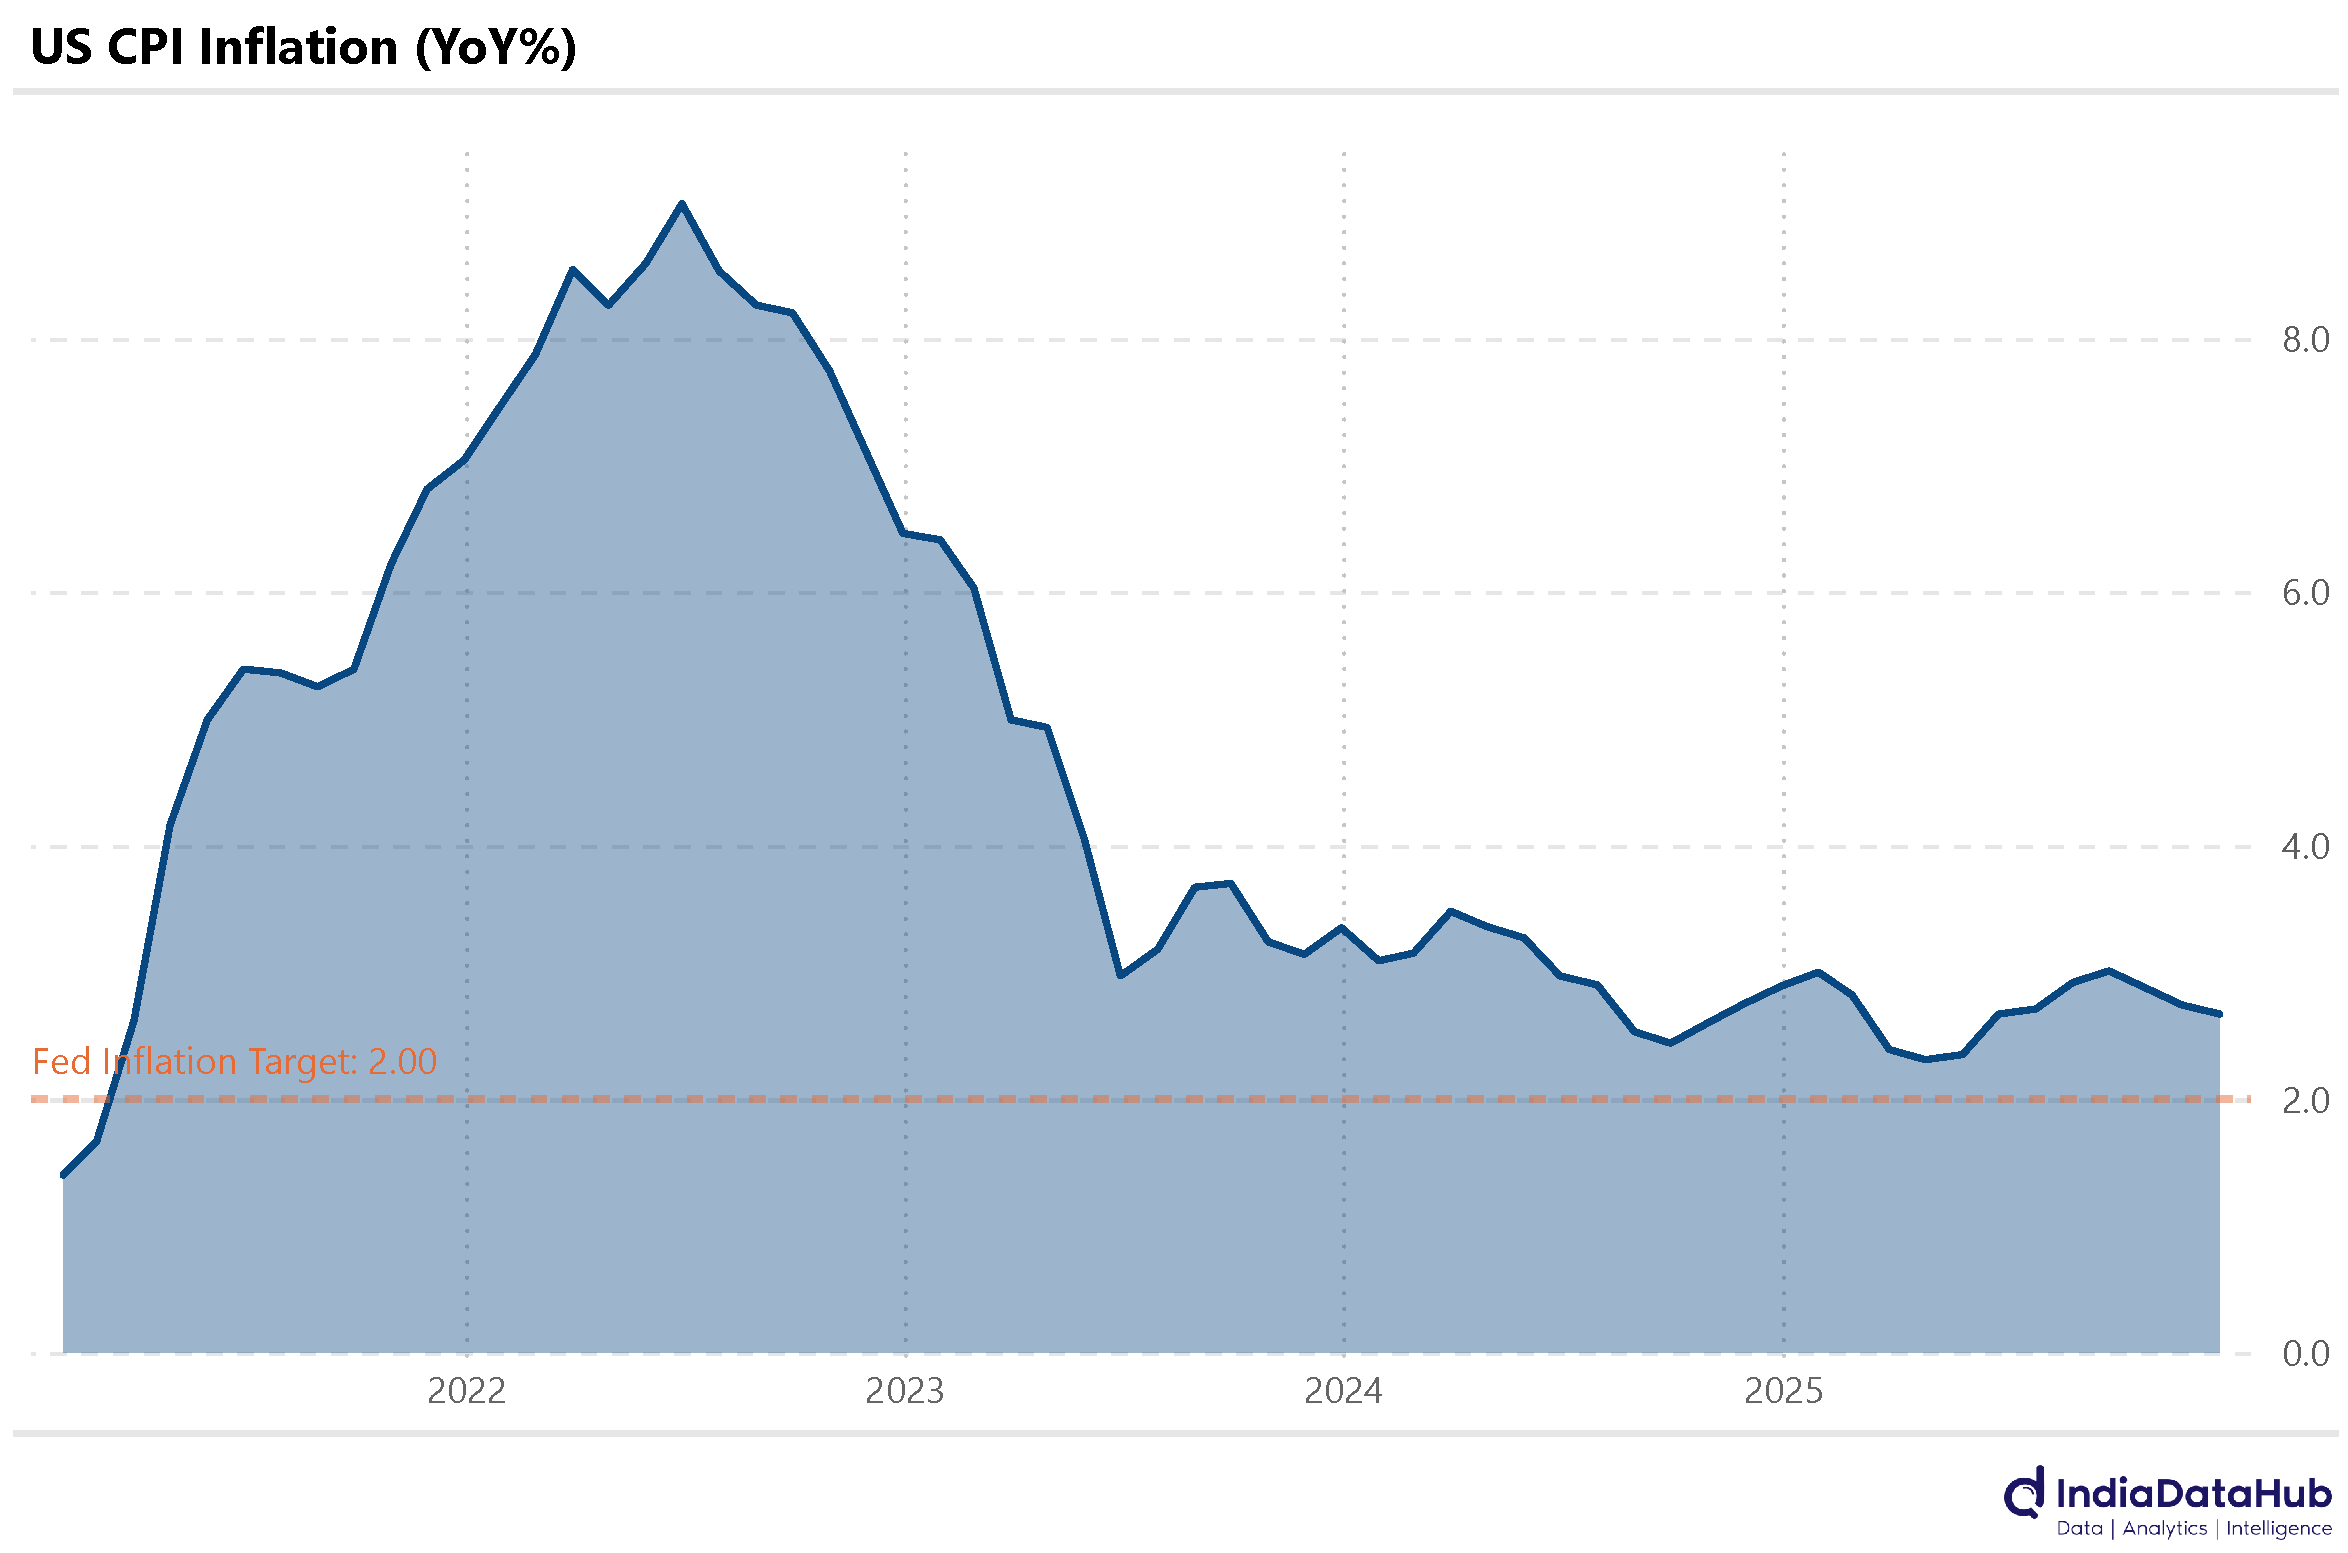
Lastly, CPI Inflation in the USA increased by 2.7% YoY in December, which was broadly the same rate as in November. Food prices continue to be the key driver of inflation, rising to over 3% YoY in December. What is noteworthy though is that US CPI Inflation has remained above the Fed’s target of 2% in every single month since February 2021 – so almost 5 consecutive years!
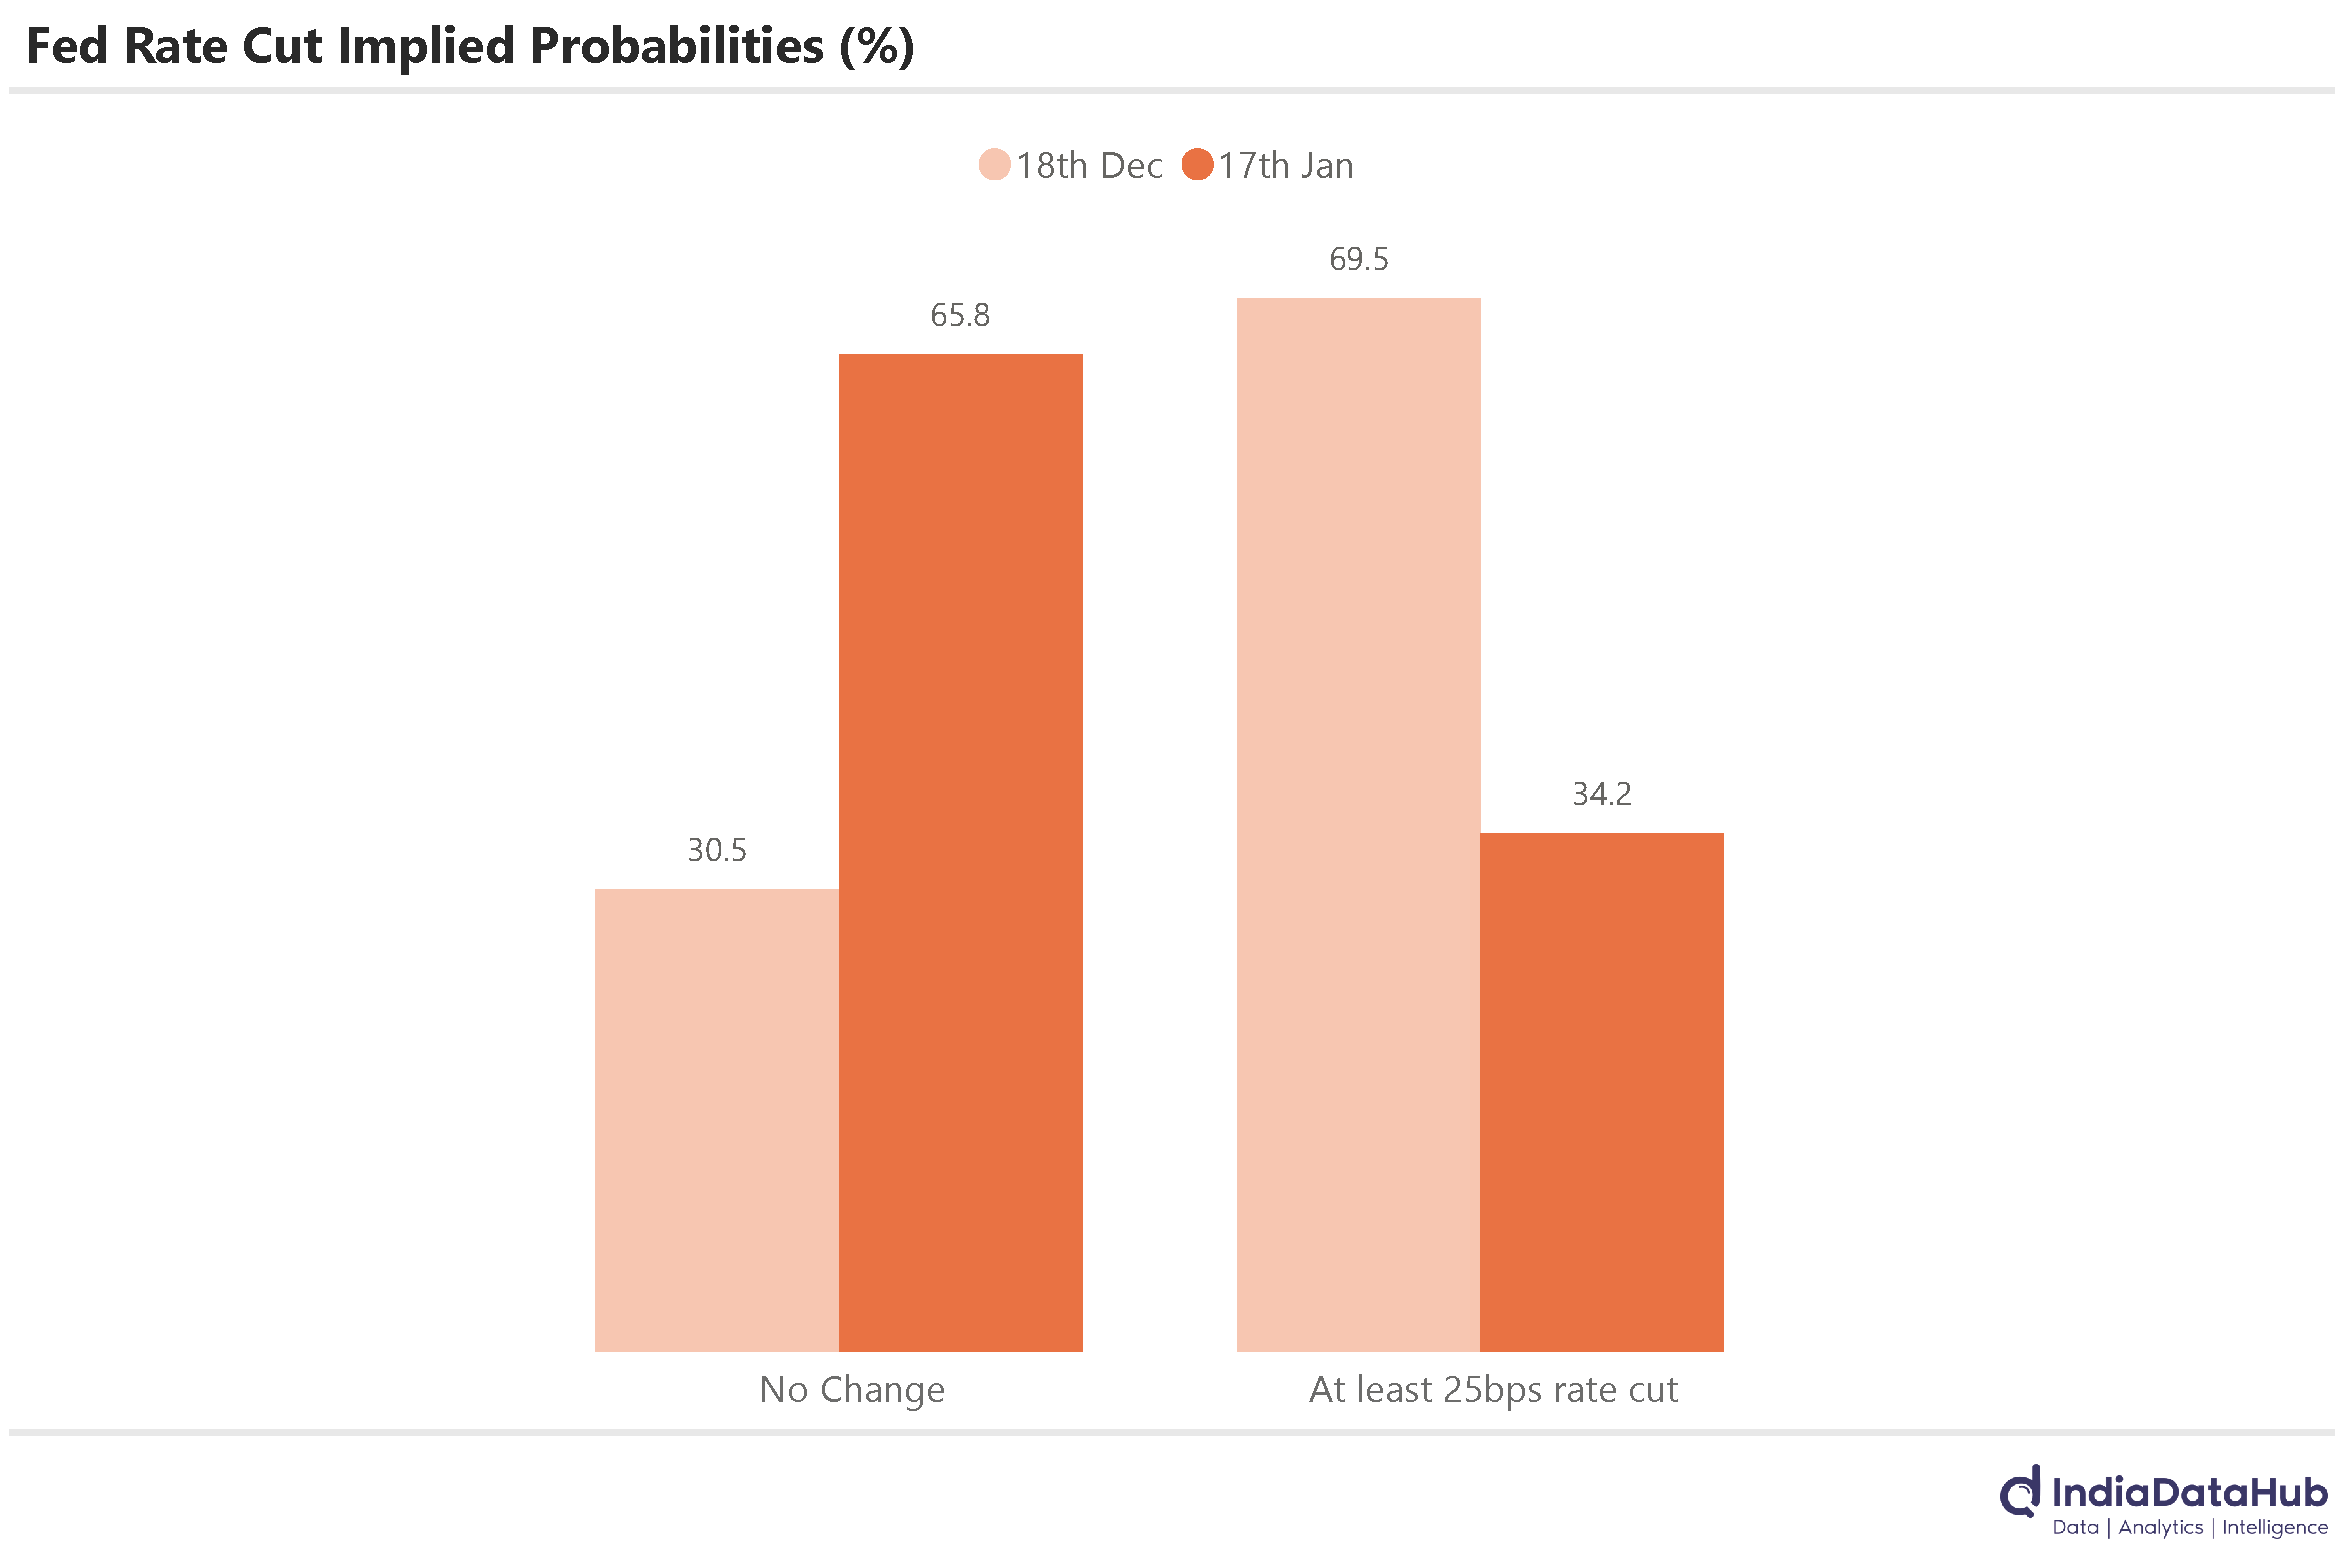
As we noted last week, the US job market has seen a marked slowdown with the economy shedding jobs in the last quarter of 2025 – the first time since Covid19. Higher inflation, even as the labour market is softening, complicates the US Fed’s job as it juggles its two objectives – price stability and full employment. Not surprisingly, then, the odds of further rate cuts from the Fed have diminished. The Fed Fund Futures are now pointing to no rate cut from the Fed till April – a month ago, they were pointing towards 70% odds of at least 1 rate cut (and 25% odds of 2 rate cuts) vs current 66% odds of no rate cut.
That’s it for this week. See you next week…
When you speak about export to China or any other country you should also state the import levels for proper analysis.